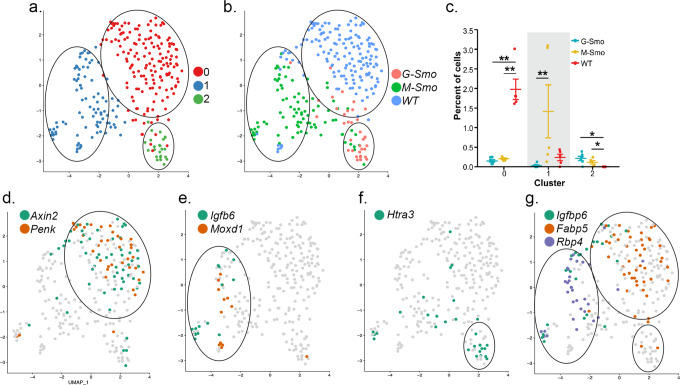
Fig. 8. Different fibroblastic populations in G-Smo and M-Smo tumors.
a UMAP showing fibroblastic cells from G-Smo, M-Smo, and P7 WT, with clusters color-coded and circled. b genotype color-coded on the UMAP from a. Circles indicate the positions of the clusters. c Comparison of the indicated cluster populations in G-Smo, M-Smo, and P7 WT. Dots represent values for individual replicates, bars indicate the means and whiskers indicate the SEM. d–g Feature plots on UMAP from a, showing expression of d Cluster F0 markers Axin2 and Penk, e Cluster F1 markers Igfbp6 and Moxd1, f Cluster F2 marker Htra3, and g retinoic acid signaling components Crabp2, Fabp5, and Rbp4. Student’s test was used in c.

