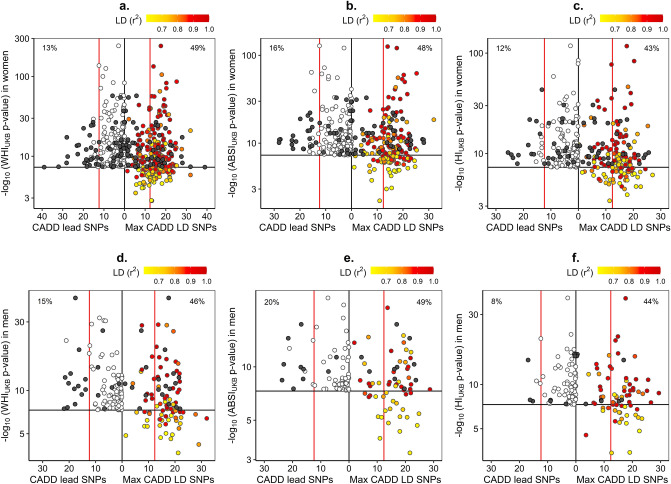
Figure 2.
Deleteriousness (CADD) score of locus lead SNPs identified for allometric body-shape indices. (a) waist-to-hip index (WHIUKB) calibrated for UK Biobank women (n = 282 genomic risk loci with the corresponding locus lead SNPs); (b) a body shape index (ABSIUKB) calibrated for UK Biobank women (n = 200); (c) hip index (HIUKB) calibrated for UK Biobank women (n = 171); (d) WHIUKB for UK Biobank men (n = 97); (e) ABSIUKB for UK Biobank men (n = 65); (f) HIUKB for UK Biobank men (n = 75). CADD-Combined Annotation Dependent Depletion; LD-linkage disequilibrium; SNP-single nucleotide polymorphism; red vertical lines-recommended cut-off 12.37 for CADD (the higher the more deleterious)12; horizontal line-genome-wide significance cut-off (P = 5*10–8); left-hand side-CADD for the locus lead SNP of each genomic risk locus, with the proportion above the cut-off; right-hand side-candidate SNPs in strong LD with the locus lead SNP (colour-coded according to r2 ≥ 0.6), showing the maximum CADD within the LD block, plotted with the corresponding significance on the y-axis; PWHI / ABSI / HI-P-values for body-shape indices, derived from BOLT-LMM infinitesimal models; (black circle)-marks the locus lead SNP when this is showing the maximum CADD within the corresponding LD block; percentages (top corners)-percentage above the cut-offs for both, CADD and genome-wide significance (all differences between left-hand side and right-hand side proportions were significant at P < 0.0001 when compared with Fisher’s exact test, except for ABSIUKB in men (P = 0.0008).

