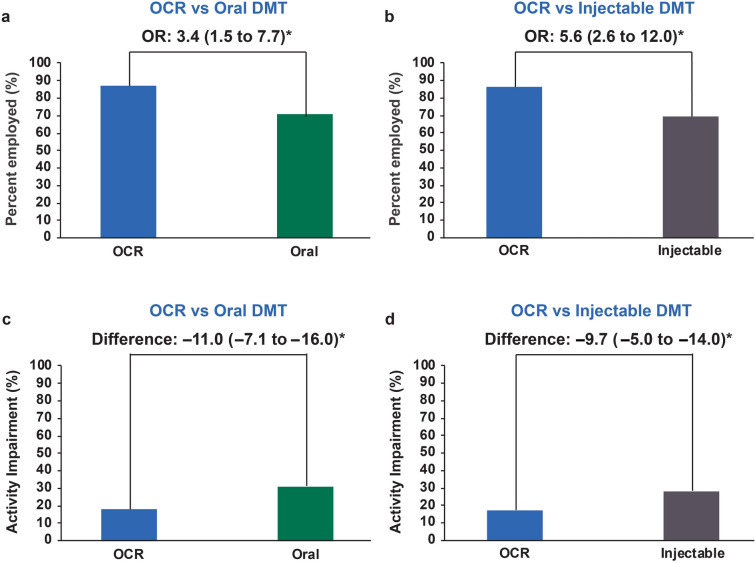
Fig. 2.
Full Work Productivity and Activity Impairment questionnaire-respondent cohort results. Bars represent propensity-weighted population proportions (employment) and means (activity impairment). a, b Employment results with OCR vs. oral DMT (a) and OCR vs. injectable DMT (b). c, d Activity impairment results with OCR vs. oral DMT (c) and OCR vs. injectable DMT (d). Data are presented with 95% confidence intervals in parentheses. Asterisk indicates statistically significant difference at α = 0.05. DMT Disease-modifying therapy, OCR ocrelizumab, OR odds ratio

