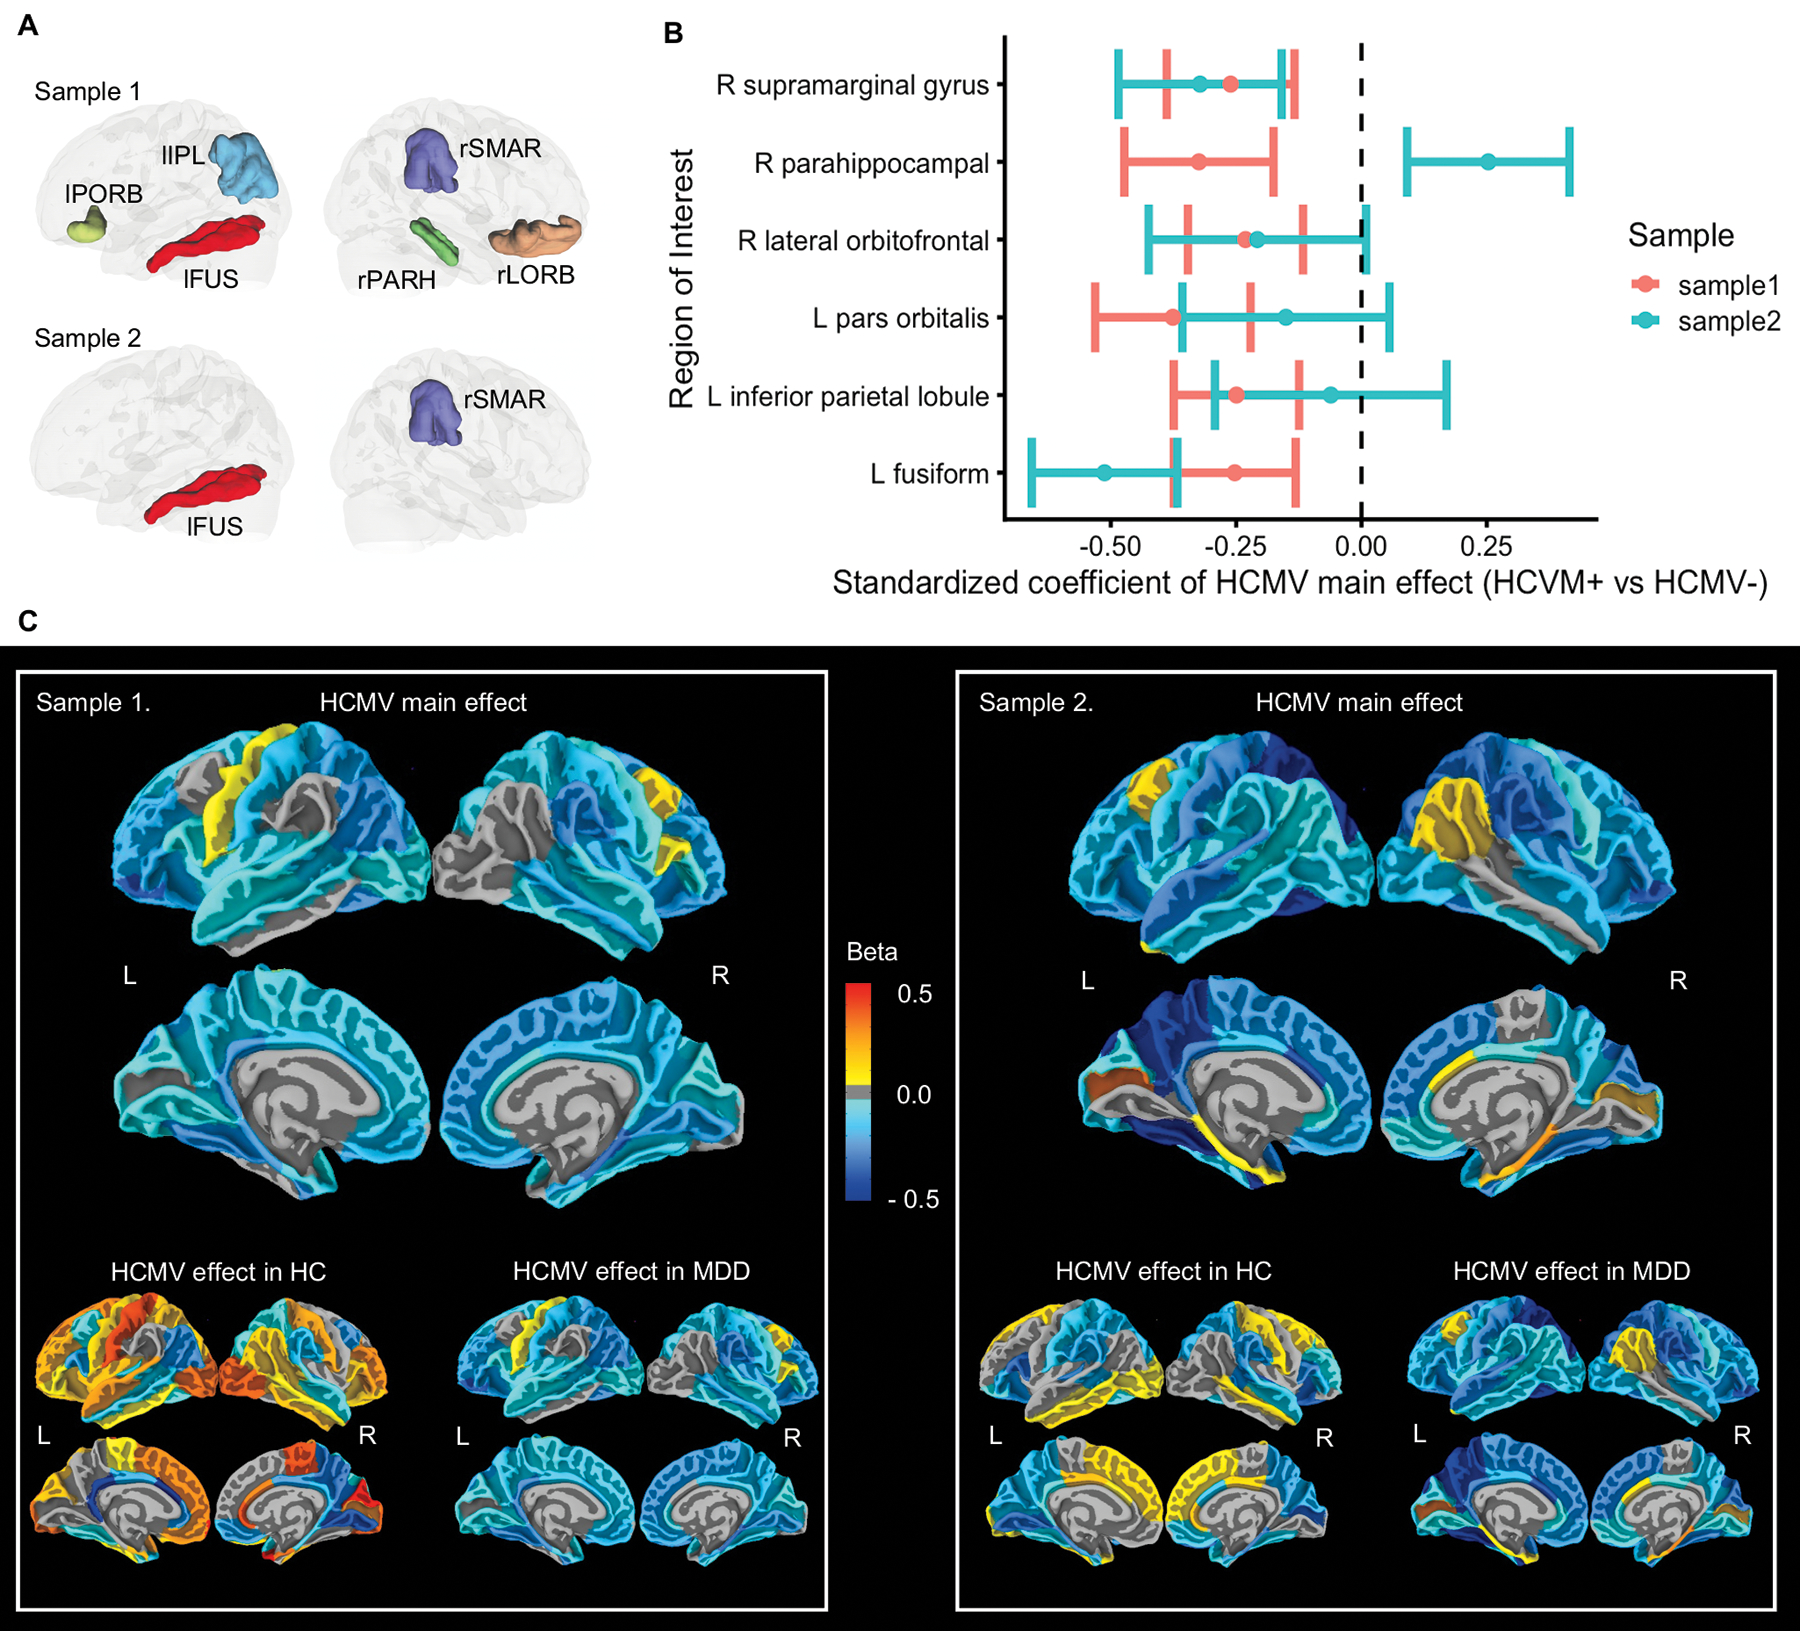
Figure 2.

Regional Effect of HCMV infection on gray matter volumes. (A) Illustration of regions that showed main effect of HCMV. Six regions were significantly smaller in HCMV+ versus HCMV− subjects in sample 1 at puncorrected < 0.05. Two out of these six regions were also significant decreased in sample 2 at puncorrected < 0.05. (B) Standardized beta coefficient as effect size with robust standard error as error bar, estimated from IPTW adjusted regression model. (C) Mapping of HCMV main effect, HCMV effect in HC, and the HCMV effect in MDD at all the cortical regions without thresholding. Colors represent the standardized beta coefficients, estimated from IPTW adjusted regression model. They range from −0.5 to 0.5, which means the mean gray matter volume of HCMV+ subgroup in given region increased or decreased by 0.5 standard deviations from HCMV− subgroup. Blue colors represent smaller gray matter volumes in HCMV+ groups, whereas yellow-red colors represent larger gray matter volumes in HCMV+ groups. Relative to HCMV− subjects, HCMV+ subjects showed smaller gray matter volumes across cortical regions in both samples, most prominently in orbitofrontal, temporal and parietal regions. The observed effects of HCMV were mainly driven by the MDD groups. Within the HCs there were less consistent differences between HCMV+ and HCMV− subgroups and the effect sizes were generally smaller.
Abbreviations: rSMAR, right supramarginal gyrus; rPARH, right parahippocampal gyrus; rLORB, right lateral orbitofrontal gyrus; lPORB, left pars orbitalis gyrus; lIPL, left inferior parietal lobule; lFUS, left fusiform gyrus.
