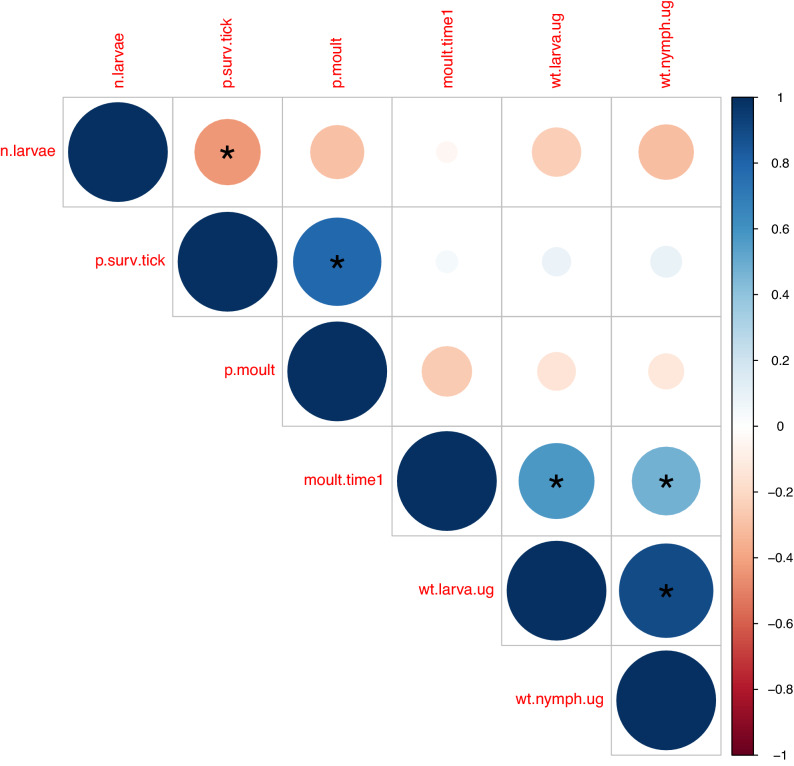
Figure 6.
Correlations between the life history traits of the immature I. ricinus ticks. The 6 variables shown include (i) number of engorged larvae that were recovered from each mouse (n.larvae), (ii) immature tick survival (p.surv.tick), (iii) larva-to-nymph moulting success (p.moult), (iv) larva-to-nymph moulting time (moult.time1), (v) weight of engorged larvae (wt.larva.ug), and (vi) weight of unfed nymphs (wt.nymph.ug). The correlations were based on the means of the life history traits of the immature ticks for each of the 39 mice. Positive correlations are shown in blue and negative correlations are shown in red. The size of the circle indicates the magnitude of the Pearson correlation coefficient. Statistically significant correlations are indicated with an asterisk.

