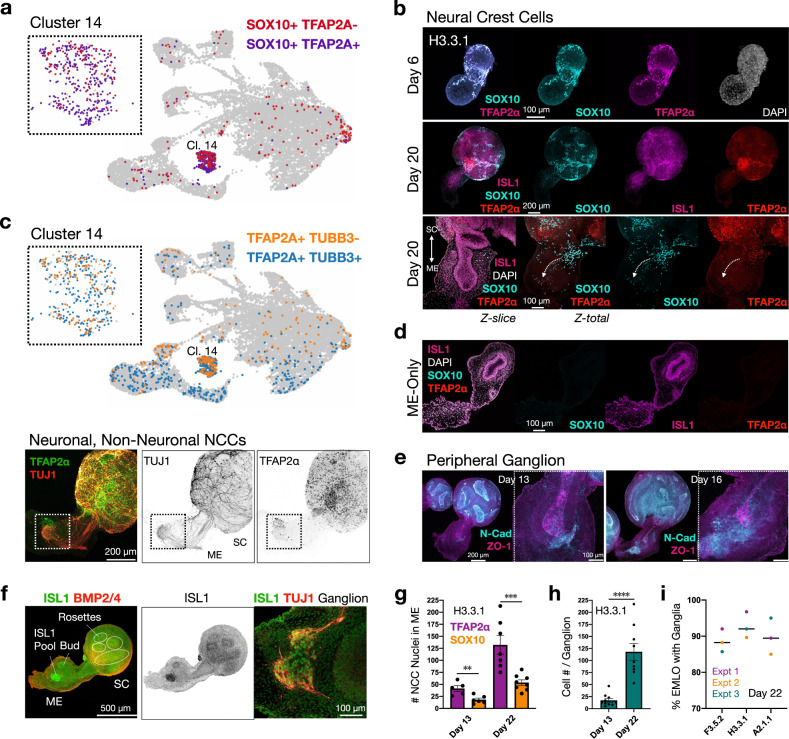
Fig. 7. Diverging NCC lineages populate the ME.
a Two SOX10-expressing neural crest cell (NCC) populations are distinguished by TFAP2A expression (purple) and non-expression (red) in day 16 EMLOs by scRNAseq. NCC cluster 14 is expanded. b TFAP2α (magenta) and SOX10 (cyan) double-positive cells in day 6 H3.3.1 EMLO (top) and diverging NCC lineages by distinct SOX10/TFAP2α immunostaining in day 20 EMLO (middle). High magnification representative day 20 EMLO is shown (bottom). White dotted arrows depict potential NCC migration about the gut tube. c Two TFAP2A-expressing NCC populations are distinguished by TUBB3 expression (blue) and non-expression (orange) (top). The NCC cluster 14 is expanded. The subsets of putative neuronal (TFAP2α+ in green, TUJ1+ in red) and non-neuronal (TFAP2α+, TUJ1−) NCCs are visualized as well by IF that is best seen at the ganglion in the white dotted box (bottom). TFAP2α signal is higher outside of the ganglion. d EMLOs lacking the spinal cord (SC) compartment does not contain NCCs, supporting an origin in SC. e N-cadherin (cyan) expression restricted to SC and the gut tube anterior pole, counterstained with ZO-1 (magenta) and shown at days 13 and 16. High magnification images provided. f ISL1 (green) and BMP2/4 (ref) IF in day 22 H3.3.1 EMLOs. ISL1+ cellular pools in proximity to the gut tube are observed in both lines, and increased expression in budding regions of the tube versus non-budding regions. High magnification ISL1 colocalization with TUJ1 is shown (right). NCC biomarkers were stained in H3.3.1 EMLOs in N = 8 of 11 formation experiments, and N = 3 formation experiments for the other representative lines. g Histogram of TFAP2α (purple) and SOX10 (yellow) positive nuclei in mesoderm–endoderm (ME) over time at day 13 (n = 5 EMLOs TFAP2α, n = 6 EMLOs SOX10) versus day 22 (n = 7 EMLOs TFAP2α, n = 8 EMLOs SOX10) in H3.3.1 EMLOs. (unpaired two-tailed t test **p = 0.0033, t = 3.814, df = 10 TFAP2α; ***p = 0.0004, t = 4.873, df = 12). h Plot of cell number (DAPI/TUJ1) per ganglion over time at day 13 (n = 10 EMLOs) versus day 22 (n = 9 EMLOs) in H3.3.1 EMLOs (****p < 0.0001, t = 5.854, df = 17). Data reported as (mean ±s.e.m.). i Histogram quantification of EMLOs with neuronal ganglionic structures in ME in F3.5.2 (n = 25), H3.3.1 (n = 31), and A2.1.1 (n = 19) ED-hiPSC lines at day 22 (median). Colors denote N = 3 separate formation experiments. Individual scale bars provided.

