Figure 2.
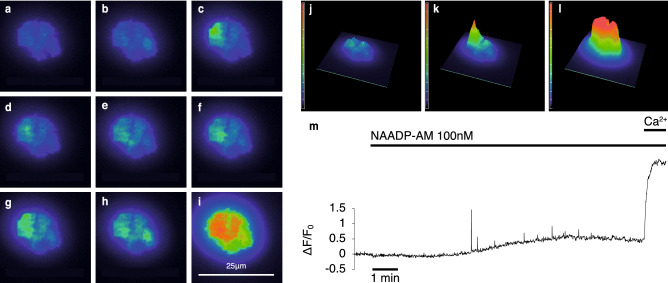
Localised and global Ca2+ responses. Responses of a β-cell cluster (3 cells) after NAADP-AM addition as observed using TIRF microscopy in the presence of 5 mM EGTA. (a) Baseline fluorescence. (b–h) Localized Ca2+ release events (for illustrative purposes, larger events were selected). (i) Global Ca2+ influx. (j–l) Intensity profiles of a β-cell cluster, (j) at baseline, (k) in the presence of an elementary event after addition of NAADP-AM, (l) during global Ca2+ influx. Images are pseudocoloured with warmer colours representing higher levels of fluorescence. (m) Representative trace of a β-cell showing spiking Ca2+ events triggered by NAADP-AM. Maximum intensity change normalised to baseline is plotted against time. Extracellular Ca2+ was re-admitted at the end of the experiment; leading to a global Ca2+ response.

