Figure 3.
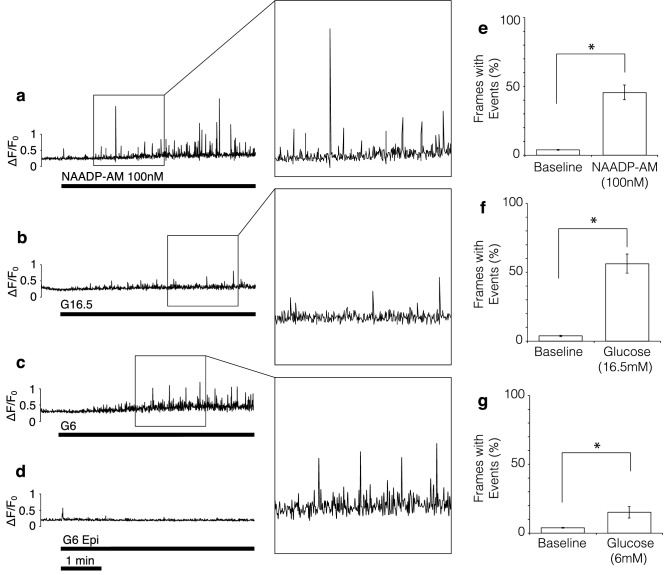
Quantification of calcium release events in response to glucose and NAADP-AM in low EGTA (100 μM). (a–c) Representative TIRF traces of β-cells stimulated with: (a) 100 nM NAADP-AM after preincubation with thapsigargin, (b) 16.5 mM glucose after preincubation with thapsigargin, (c) 6 mM glucose without thapsigargin preincubation. (d) Epifluorescence recording (all other parameters equal) using 6 mM glucose without thapsigargin preincubation. Maximum intensity change of subsequent frames after normalising to baseline plotted against time. Insets show magnified events for each of the three experimental stimuli, chosen to illustrate the variation in event size. (e–g) Percentage of frames showing elementary events (defined as events of an amplitude more than 2 standard deviations above baseline mean) before (baseline) and after stimulus addition. (e) NAADP-AM; n = 20 (8 experiments, 4 Animals), t(19) = 7.90, p < 0.01, 90% response rate. (f) 16.5 mM glucose; n = 14 (6 experiments, 4 Animals), t(13) = 7.44, p < 0.01, 100% response rate. (g) 6 mM glucose; n = 18 (6 experiments, 6 Animals), t(17) = 2.61, p < 0.01, 50% response rate. * denotes significance; paired samples, one-tailed t-tests.

