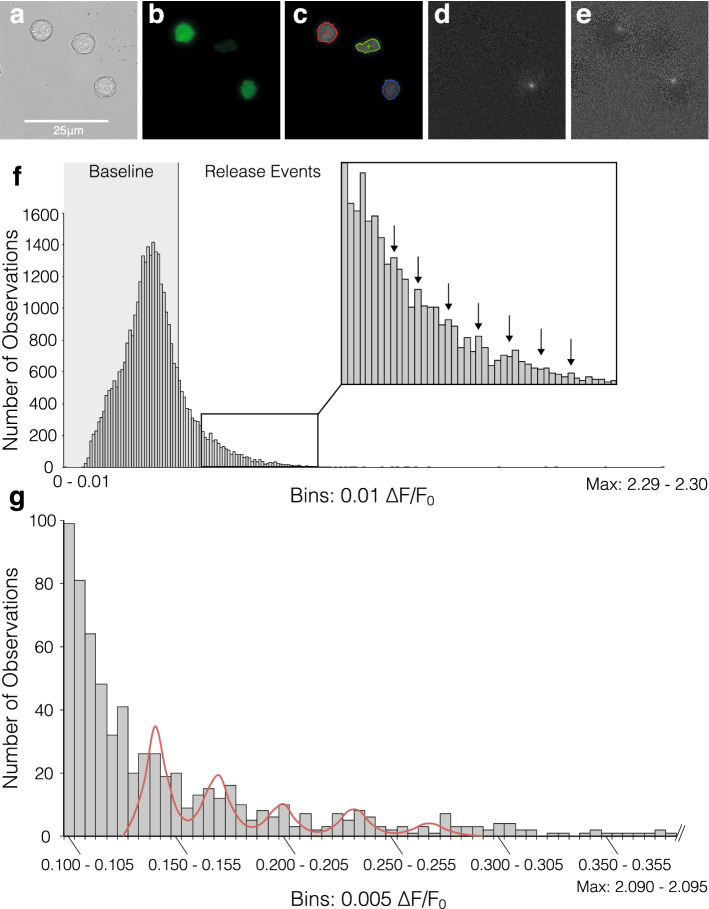
Figure 4.
Quantal analysis of elementary events. (a–e) Illustration of spark analysis, including examples of elementary release events in response to 16.5 mM glucose detected by normalisation, frame by frame and background subtraction in 3 individual β-cells: (a) Original brightfield, (b) TIRF, (c) Boundaries used in detection analysis, (d–e) Individual events isolated by analysis. Note that images of glucose-induced events were chosen for illustration of the analysis mechanism; quantal analysis was carried out exclusively on NAADP-AM stimulated cells. (f) Frequency histogram of maximum intensity change after NAADP-AM Stimulation (n = 20), the vertical line at 0.44 ΔF/F0 denotes 2 standard deviations above baseline mean. (g) Frequency histogram of mean event amplitudes across areas of interest (n = 51) within a single cell cluster stimulated with NAADP-AM in the presence of 5 mM EGTA. The five peaks of the putative modal distribution in the data were selected as means for individual Gaussian distributions; and 3–4 bins to their left and right used to calculate the respective distribution’s standard deviation. The resultant means and standard deviations were used to fit a quintuple Poly-Gaussian function (Sum of five Gaussian functions with Means, SDs: 0.143, 0.007; 0.171, 0.008; 0.201, 0.0089; 0.235, 0.0092; 0.270, 0.0103, respectively) to the data. Histogram was cropped for better resolution-values below event cutoff (2 standard deviations above baseline mean: 0.1 ΔF/F0) are not included and actual maximum intensity bin is 2.09–2.095.

