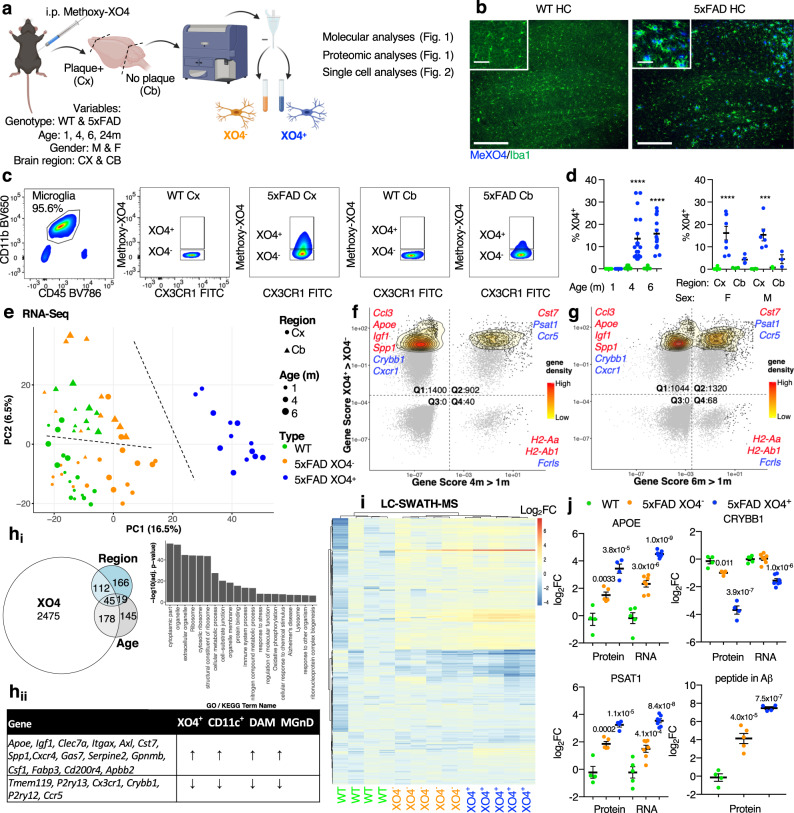
Fig. 1. Methoxy-XO4 labels a molecularly distinct plaque-phagocytic population in 5xFAD mice.
a Schematic of the methodology employed in this study, created with BioRender.com. M, male, F, female, WT, wild-type, Cx, cortex and subcortical regions, Cb, cerebellum. b Representative immunofluorescence image of the hippocampus (HC) of WT and 5xFAD mice injected with methoxy-XO4 and stained with Iba1 (AlexaFluor 488, n = 6 animals per genotype), scale bar = 250 μm, inset 50 μm. c Representative FACS plot showing that XO4+ microglia are present in 6 m 5xFAD plaque-affected regions (top panels). d Left, the percentage of XO4+ microglia isolated from plaque-affected regions in 1, 4 and 6 m old WT (m, month) and 5xFAD mice (from n = 6 animals per genotype at 1 m; 4 m WT, n = 19 animals; 4 m 5xFAD, n = 22; 6 m WT, n = 14; 6 m 5xFAD n = 14) and right, the percentage of XO4+ microglia isolated from plaque-affected and non-affected regions in 6 m old male and female WT and 5xFAD mice (F, Cx, n = 8 per genotype; M, Cx, n = 6 per genotype; F, Cb, n = 4 per genotype; M, Cb, n = 3 per genotype), expressed as mean ± SEM, ***p = 0.003 and ****p = 4.6 × 10⁻⁵ for 4 m, p = 9 × 10⁻⁶ for 6 m, and p = 5.2 × 10⁻⁵ for F Cx vs Cb by Kruskal-Wallis and Dunn’s multiple comparison tests. e PCA of bulk RNA-seq. Cx, Cortex; Cb, Cerebellum. f, g Gene cytometry plots showing DEGs between XO4+ and XO4− microglia and/or DEGs expressed between old (4, 6 m) and young (1 m) microglia. Gene scores are calculated as the product of the LFC and –log10(FDR). Example genes in each quadrant are labelled in red (upregulated over time or phagocytosis) or blue (downregulated). Gene density low = 0, high = 0.2. hi Venn diagram showing the overlap between genes whose expression levels could be explained by the age, region and XO4 covariate as well as GO and KEGG terms associated with XO4 covariate genes. hii Table showing the 21 core microglial neurodegeneration signature genes and their direction of differential expression in DAM28, CD11c+ 29, MGnD30 and XO4+ microglia. i Heatmap of targeted LC-SWATH-MS analysis of detected peptides within DEGs in biological replicates of WT (green, n = 4 animals), XO4− 5xFAD (orange, n = 5) and XO4+ 5xFAD (blue, n = 4) microglia. Colour scale represents log2-transformed normalized fold changes compared to WT microglia. clustering method = ward.D2, distance = maximum. j Comparison of RNA and protein expression for selected genes, and quantitation of a tryptic peptide in Aβ in microglia. Data are expressed as mean ± SEM LFC compared to WT microglia, normalized relative to peptides in Supplementary Data 4. p-Values were calculated by one-way ANOVA using Holm-Sidak’s multiple comparison test. Data are from WT (n = 4 animals), XO4− 5xFAD (n = 5), XO4+ 5xFAD (n = 4) for protein analyses; WT (n = 5), XO4− 5xFAD (n = 7), XO4+ 5xFAD (n = 7) for RNA analyses.

