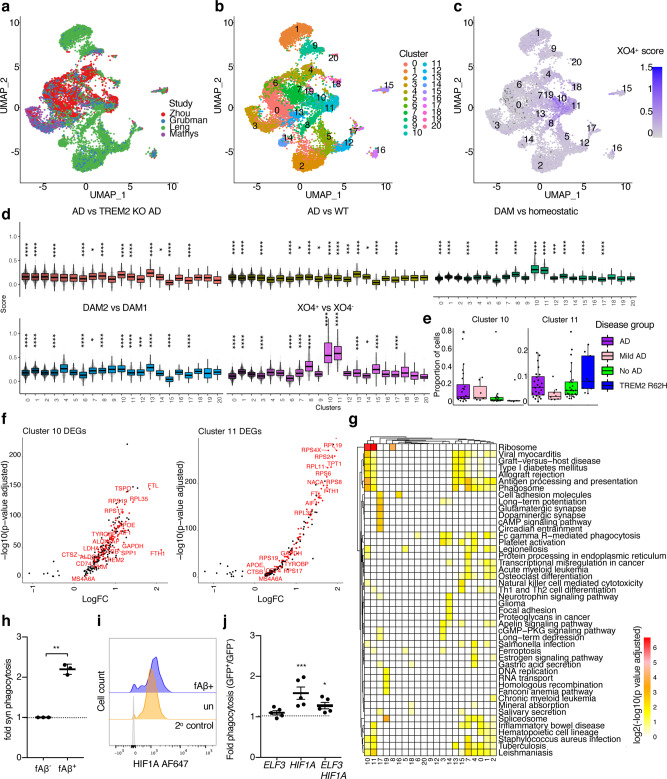
Fig. 5. The gene expression signature associated with XO4+ microglia is molecularly and functionally replicated in microglia isolated from the brains of AD patients and non-AD patients.
a–c UMAP projection of single microglia nuclei from control and AD patient entorhinal and frontal cortex samples, combined by integrating data from51–54, comprising 102 patients; AD (n = 5891 microglia nuclei), mild AD (n = 1591 microglia nuclei), controls (n = 2988 microglia nuclei), Other Dementia (n = 3 microglia nuclei) and TREM2 R62H variant (n = 1458 microglia nuclei). Clustering and analysis of signature scores is performed using Seurat v3. UMAP projection is coloured by (a) study of origin, (b) Seurat cluster and (c) XO4+ score. d Box plots for gene signature scores in each human microglial cluster for the AD vs Trem2KO AD signature, AD vs WT signature51, DAM vs homeostatic, and DAM2 vs DAM1 signatures13. The lower, middle and upper hinges represent the lower quartile, median and upper quartile, respectively, while the upper and lower whiskers extend ±1.5 times of the interquartile range from the hinges. For each signature score category, pairwise Wilcoxon test between each cluster and base mean was computed. Multiple testing was corrected for using Bonferroni correction. *p < 0.05, **p < 0.01; ***p < 0.001, ****p < 0.0001, exact p values are provided in the Source data. e The proportion of cells in Clusters 10 and 11 in patients with any cells in Cluster 10 or Cluster 11, respectively (please see Supplementary Fig. 11 for sample size details), grouped according to disease status and/or TREM2 genotype (*p = 0.047, Wilcoxon Test with No AD as reference). The lower, middle, and upper hinges represent the lower quartile, median and upper quartile, respectively, while the upper and lower whiskers extend ±1.5 times of the interquartile range from the hinges. f Cluster 10 and Cluster 11 DEGs relative to all other human microglia clusters (adjusted p-value < 0.05). Genes of interest associated with XO4+ microglia are highlighted in red. g Heatmap of enriched KEGG pathways in the human microglial Seurat clusters, coloured by log2(-log10(adjusted p-value)). h Fluorescently labelled synaptosome internalization by human primary microglia treated with AF647-labelled fAβ. The data are mean ± SEM of 3 independent biological replicates and are expressed as fold change in synaptosome internalization relative to non-treated microglia. Differences are reported between AF488-fAβ+ and AF488-fAβ− cells tested from within the same well. i Histograms showing fluorescence intensity of HIF1A intracellular staining in AF488-fAβ+ and AF488-fAβ− human primary microglia assayed from within the same well. Secondary antibody control cells are stained with AF647 secondary antibodies alone. j Fluorescently labelled synaptosome internalization by primary microglia transfected with GFP-tagged inducible HIF1A and/or ELF3 overexpression constructs. The data are the mean ± SEM of 5 independent biological replicates and are expressed as fold change in synaptosome internalization between GFP+ and GFP− (non-transfected) cells tested from within the same well. *p = 0.0188, ***p = 0.0002 by two-way ANOVA and Sidak’s multiple comparison test on the raw synaptosome internalization percentages.

