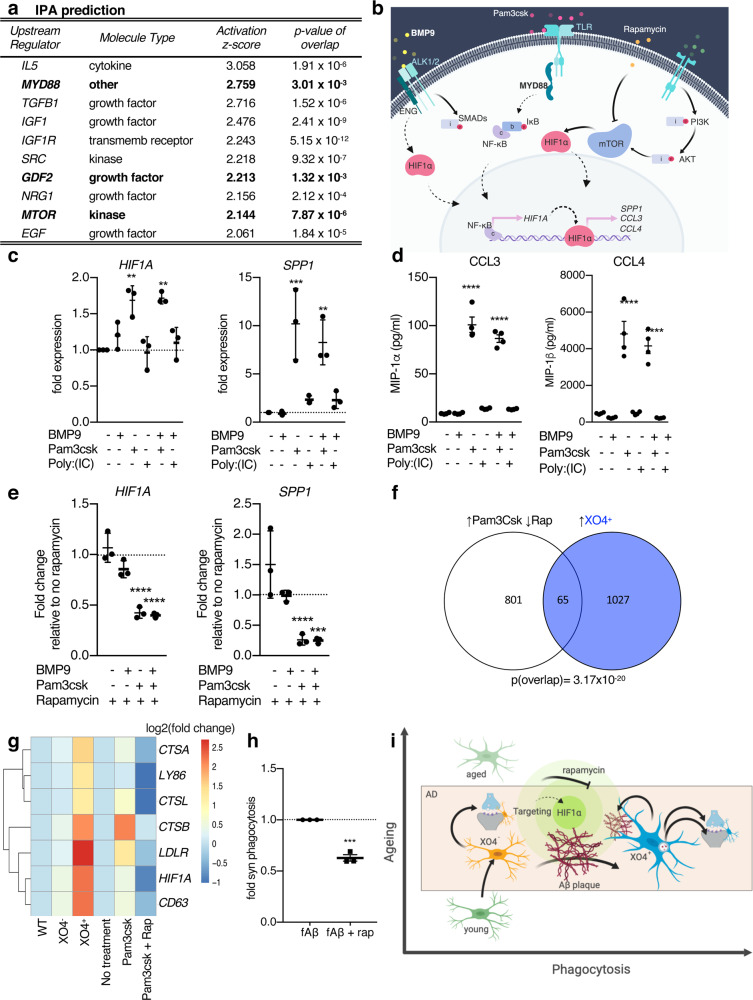
Fig. 6. The gene expression signature associated with XO4+ microglia can be manipulated through the Hif1a regulon.
a Top ten activators of the Hif1a regulon predicted by IPA. The activation z-score is a statistical measure of the match between the expected relationship direction of regulation and the observed gene expression; positive z-scores are indicative of predicted activation. p-Value of overlap refers to the significance of the overlap between the Hif1a regulon gene set and the regulated target genes predicted by IPA. The 3 predicted regulators tested in this figure are in bold. b Cartoon diagram of hypothesis generated by IPA. c Stimulation of iMGLs with MyD88-dependent TLR-agonist Pam3csk (alone or with BMP9) induces genes associated with XO4+ microglia within the Hif1a regulon as identified by qPCR (HIF1A **p = 0.0014 and p = 0.0012, respectively, SPP1 ***p = 0.00024 and **p = 0.0015 by one-way ANOVA and Holm-Sidak post-test), n = 3 independent experiments. d Cytometric bead array (****p < 0.0001 by one-way ANOVA and Holm-Sidak post-test, CCL3: F(5,18)=137.1; CCL4: F(5,18)=42.04), n = 4 independent experiments. MyD88-independent TLR stimulation (Poly:IC) does not shift iMGLs towards a gene expression signature associated with XO4+ microglia. Data are fold changes normalized to non-treated cells. e MyD88-dependent expression of genes associated with XO4+ microglia is modulated by rapamycin. Data are fold changes induced by rapamycin normalized to each respective treatment in the absence of rapamycin. HIF1A ****p = 3.5 × 10⁻⁷ and 1.7 × 10⁻⁷ and SPP1 ****p = 6.5 × 10⁻⁵ and ***p = 0.0006, respectively, by two-way ANOVA compared to non-rapamycin-treated cells and Holm-Sidak post-test. n = 3 independent experiments. f Venn diagram showing the overlap between a XO4+-like state induced in iMGLs using Pam3csk and reversed by rapamycin (RNA-seq, n = 4 independent experiments) as predicted by ingenuity pathway analysis (IPA) with the mouse gene expression signature associated with XO4+ microglia, as measured by RNA-seq (p = 3.17 × 10⁻²⁰, hypergeometric test). g Representative gene expression heatmap of selected genes that are part of the overlap, showing expression levels in mice (WT, 5xFAD XO4−, 5xFAD XO4+) and human iMGLs (non-treated, Pam3csk and Pam3csk+rapamycin). h Fluorescently labelled synaptosome internalization by iMGLs treated with amyloid fibrils, alone, or in combination with rapamycin for 48 h, as measured by FACS. The data are presented as mean ± SEM, and p = 0.0002 by unpaired t-test, n = 3 independent experiments. i Proposed model of generation and regulation of microglia diversity in AD, created with BioRender.com.

