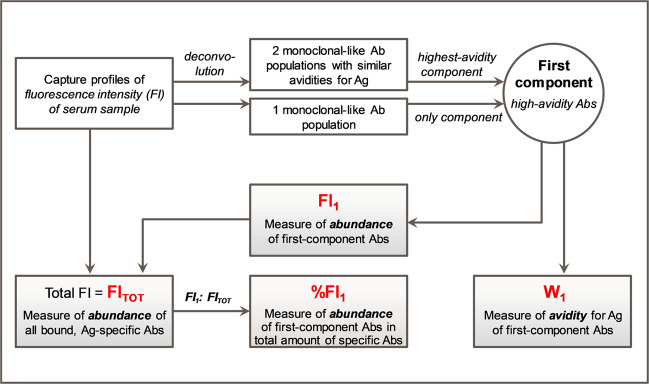
Fig. 3. Summary of the data analysis strategy and main parameters.
Figure summarizes the data analysis pipeline applied to characterize the avidity of polyclonal antibody (Ab) populations in sera obtained after vaccination (see Suppl. Fig. 5 and “Methods” section for details). Fluorescence intensity (FI) data representing the antigen (Ag)-Ab binding (antibody ‘capture profiles’) were obtained by microfluidic ligand-binding immunoassay. The area under the capture profile represented the total amount of HBsAg-specific antibodies in the sample (FITOT). Modeling of the capture profiles using a deconvolution algorithm-generated one or two monoclonal-like Ab populations with similar avidities (‘components’). Abs in the highest-avidity (‘first’) component is characterized by %FI1 (FI contribution from these Abs [FI1] relative to the FITOT), and the avidity score W1 representing the binding strength of these Abs. Parameters indicated in red font were used to characterize the abundance and avidity of the sera. The cutoff for high-avidity Abs was defined as W1 < 5, corresponding to approximately KD < 10−10 M.

