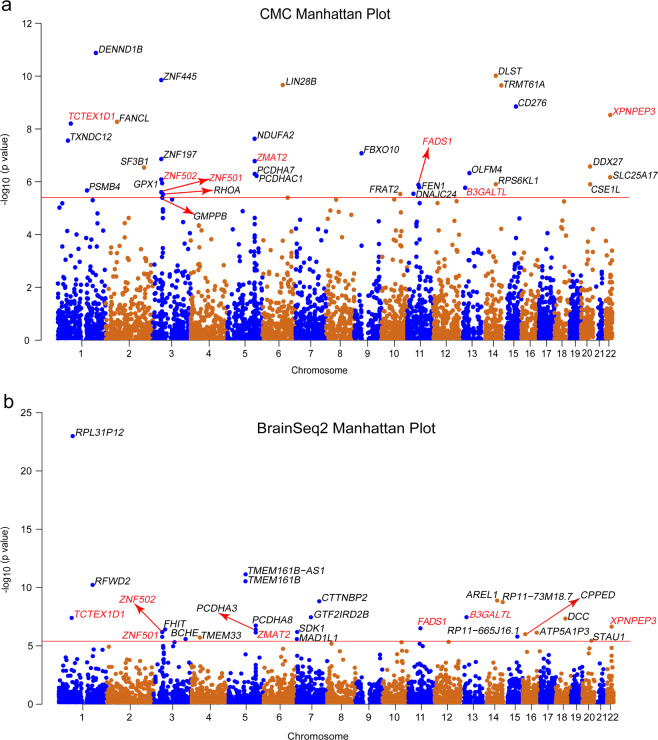
Fig. 1. Manhattan plot of the TWAS results for depression (246,363 cases and 561,190 controls).
a Manhattan plot of TWAS results in CMC dataset (a total of 33 significant genes detected). b Manhattan plot of TWAS results in BrainSeq2 dataset (a total of 27 significant genes detected). Each point represents a gene, with physical genomic position (chromosome, basepair) plotted on the x-axis and association P-value (the −log10 (FUSION P-value)) between gene expression in the DLPFC and depression plotted on the y-axis. Bonferroni-corrected significant genes are labeled and the significance threshold of P = 7.91 × 10⁻⁶ was used. Seven genes reached transcriptome-wide significance in both two expression panels (including B3GALTL, FADS1, TCTEX1D1, XPNPEP3, ZMAT2, ZNF501 and ZNF502) and are highlighted in red colour.

