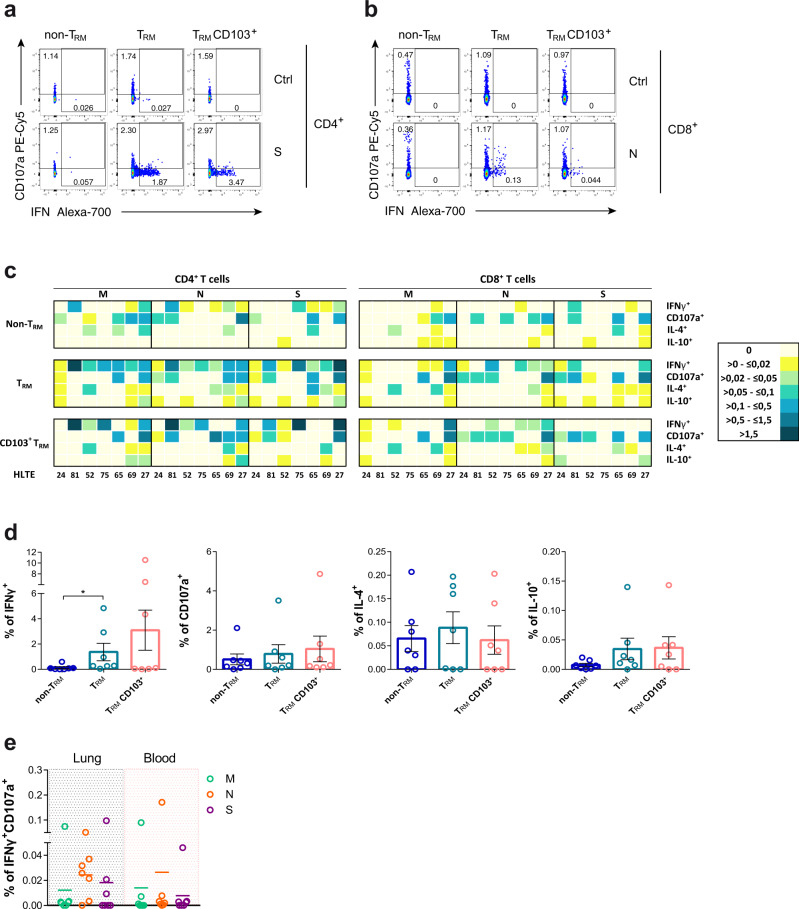
Fig. 6. Functional analysis of lung-resident SARS-CoV-2-specific T cells.
a, b Flow cytometry plots showing the frequency of interferon (IFN)γ and degranulation (CD107a) by non-resident memory T cells (TRM), TRM or CD103+ TRM in CD4+ from HL27 after spike stimulation and control (a) and in CD8+ from HL52 after nucleocapsid stimulation and control (b). c Heatmaps summarizing the net frequencies of IFNγ, CD107a, interleukin (IL)-4, and IL-10 SARS-CoV-2-specific CD4+ or CD8+ non-TRM, TRM, and TRM CD103+ from seven different SARS-CoV-2 recovered patients. Cytokine production or degranulation are displayed as colors ranging from yellow to blue, based on the frequency, as shown in the key. d Net frequency of SARS-CoV-2-specific CD3+T cells in response to all viral proteins (membrane (M), nucleocapsid (N) and spike (S)) from from lung by non-TRM, TRM or CD103+ TRM are shown as mean ± SEM (n = 7). Statistical comparisons were performed using Kruskal–Wallis rank-sum test with Dunn’s multiple comparison test (two-sided): p = 0.023. e Net frequency of double positive IFNγ/CD107a CD3+T cells from lung or blood after stimulation with membrane (M; green), nucleocapsid (N; orange), or spike protein (S; purple) (n = 7).

