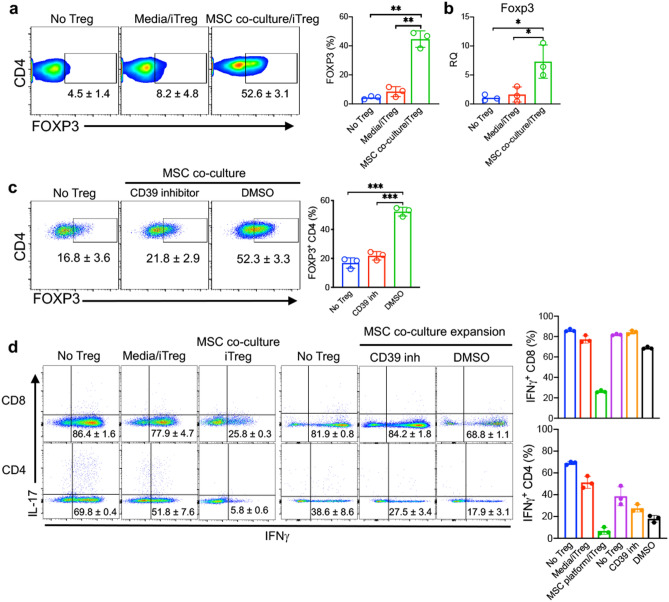
Figure 7.
MSC co-culture expanded iTregs suppress effector T cell response in GVHD inflammation. (a) FOXP3+ CD4 T cells were measured from no iTreg, media expanded iTreg, and MSC co-culture expanded iTreg treated mice. NSG mice received 107 PBL and iTregs were injected at 7 days after PBL injection. Spleen cells were collected at day 14 after PBL injection. (b) FOXP3 expression, as quantified by RT-PCR, in the spleen cells. Measurement of FOXP3+ CD4 T cells in iTreg-treated mice. iTregs were expanded in MSC co-culture with CD39 inhibitor vs control. 10 days after expansion, iTreg cells were injected into PBL-treated NSG mice. Spleen cells were collected at day 14 after PBL injection. Expression of IFNγ and IL-17 was measured by flow cytometry in CD4 T cells. (d) Measurement of IFNγ producing CD4 and CD8 T cells was performed by flow cytometric analysis. Data are representative of n = 3–4 independent samples. *p < 0.05, **p < 0.01, ***p < 0.001 paired t test. See also Supplementary Figs. S8 and S9.

