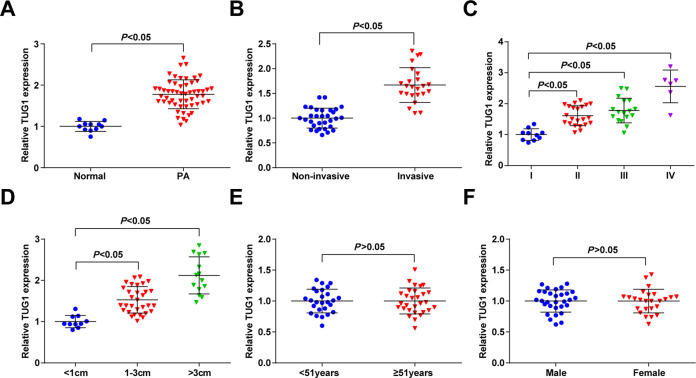
Fig. 1. Expression of TUG1 in PA and its correlation with tumorigenesis.
A TUG1 expression in PA tissues was detected using RT-qPCR; B TUG1 expression in invasive and non-invasive PA tissues was detected using RT-qPCR; C TUG1 expression in PA tissues with different knosp grades was detected using RT-qPCR; D, TUG1 expression in PA tissues with different tumor sizes was detected using RT-qPCR E, TUG1 expression in PA tissues from PA patients with different ages was detected using RT-qPCR; F, TUG1 expression in PA tissues from PA patients with different genders was detected using RT-qPCR; n = 11 in the normal group and n = 55 in the PA group. Data are presented as mean ± SD.

