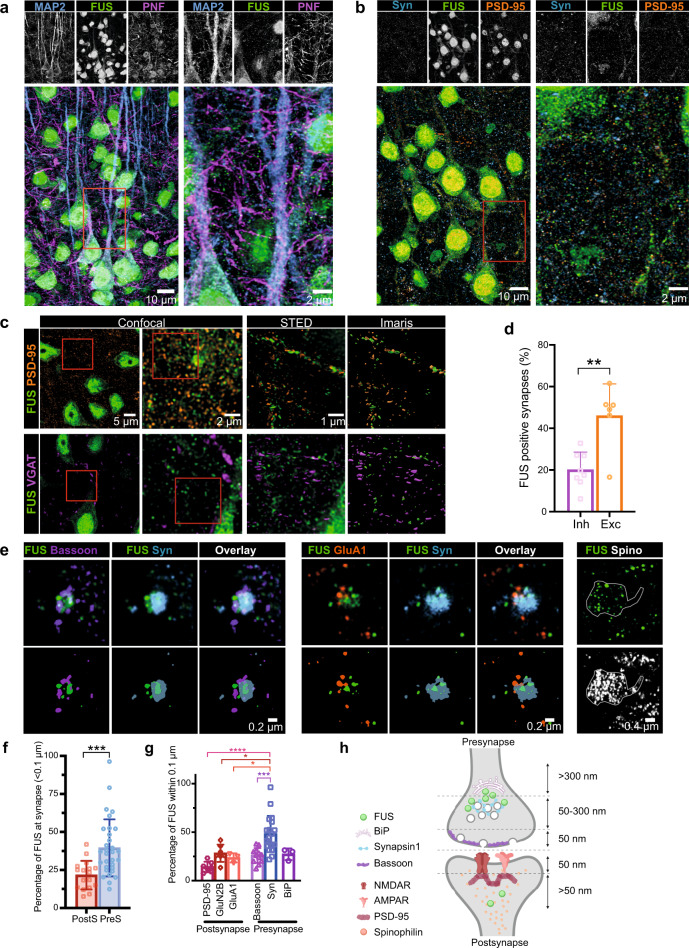
Fig. 1. FUS is enriched at the presynaptic compartment.
a Confocal images showing the distribution of Fused in sarcoma (FUS) (green) in the pyramidal layer of the retrosplenial cortical area along with microtubule-associated protein 2 (MAP2) (blue) and phospho-neurofilament (PNF) (magenta). Left panel shows the overview and the right panel the zoomed-in area labeled with the red box on the left panel. n = 5 independent mice. b Similar confocal images showing FUS (green) along with postsynaptic density protein (PSD95) (orange) and Synapsin 1 (Syn, blue). n = 5 independent mice. c Synaptic localization of FUS was assessed by STED microscopy using excitatory (PSD95) and inhibitory (vesicular GABA transporter (VGAT)) markers for synapses. 60 μm brain sections were analyzed and the distance between FUS and the synaptic markers was analyzed using Imaris. n = 5 independent mice. d Bar graph representing the percentage of synapses within 200 nm of FUS clusters and showing an enrichment of FUS at the excitatory synapses. n = 5 independent mice for both VGAT and PSD analysis. For VGAT (4 fields of view in the PTLp cortical area with n = 286 VGAT (+) synapses analyzed,), for PSD (2 fields of view in the PTLp cortical area with n = 193 PSD (+) synapses analyzed, Two-tailed, unpaired t-test, p value = 0.0016. e dSTORM was used to explore the precise FUS localization within the synapse, using primary culture. Bassoon and Synapsin 1 (Syn) were used to label the presynaptic compartment and GluN1 (subunit of NMDAR), GluA1 (subunit of AMPAR) and PSD95 were used to label the postsynapse. Spinophilin (Spino) was used to label the spines. n = 3 independent neuronal cultures. f Bar graph representing the percentage of FUS localized within 100 nm from presynaptic or postsynaptic markers. Images were acquired in 2D and represent only one plane. Each punctum represents one imaged field of view. n = 3 independent neuronal culture, with n = 17 fields of view analyzed for postsynaptic markers and 31 fields of view analyzed for presynaptic markers. p value = 0.0006, two-tailed, unpaired t-test. g Bar graph representing the distribution of FUS in the synapse. n = 3 independent cultures, n = 7 fields of view for PSD95 and GluN2B (subunit of NMDAR), n = 3 fields of view for GluA1, n = 12 fields of view for Bassoon, n = 19 fields of views for Synapsin 1 and n = 3 fields of view for endoplasmic reticulum (ER) marker (BiP). p value = <0.0001, One-way ANOVA with Tukey’s multiple comparisons post hoc test. h Schematic summarizing the FUS localization within the synapse. Graph bar showing mean + SD. *p > 0.05, **p > 0.01, ***p > 0.001, ****p > 0.0001.

