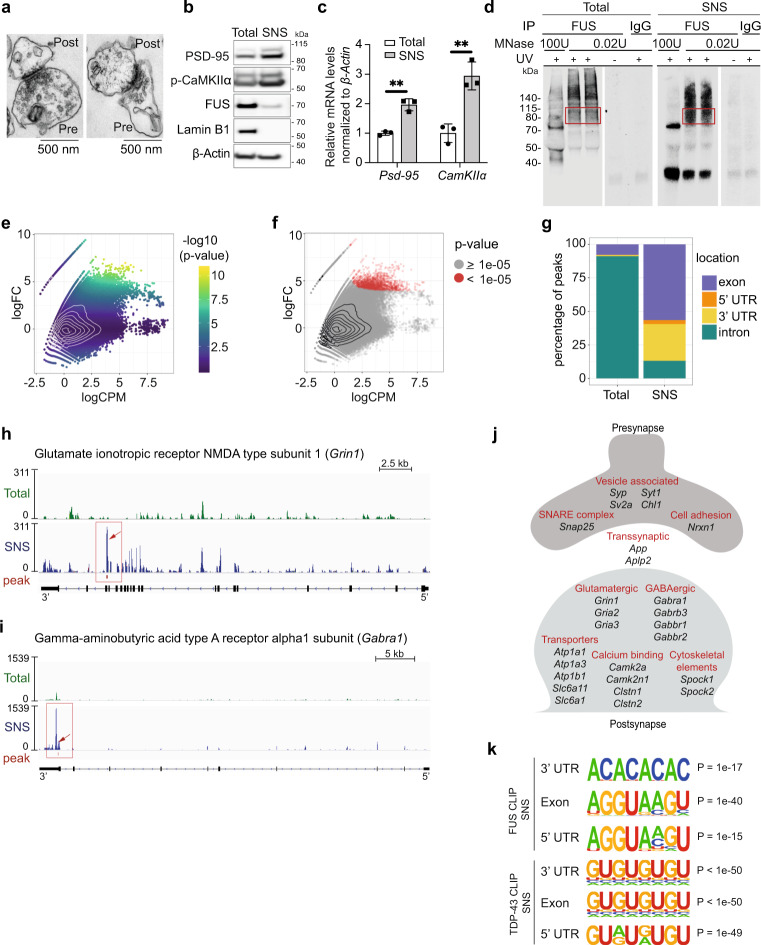
Fig. 2. CLIP-seq on cortical synaptoneurosomes identified FUS-associated pre- and postsynaptic RNAs.
a Electron microscopic images of synaptoneurosomes (SNS) from mouse cortex showing intact pre- and postsynaptic compartments. n = 2, independent experiments. b Western blot of synaptic proteins (postsynaptic density protein (PSD95), phospho-calcium/calmodulin-dependent kinase IIα (p-CamKII)), nuclear protein (Lamin B1), and Fused in sarcoma (FUS) in total cortex and synaptoneurosomes. n = 6 biological replicates. Source data are provided as a Source Data file. c qPCR shows enrichment of PSD95 (p-value = 0.0015), and CamKII mRNAs (p-value = 0.0040) in synaptoneurosomes compared to the total cortex. Bar graphs represent mean ± SD. Each dot represents total and SNS samples prepared from three independent mice. n = 3, **p < 0.01, two-tailed, unpaired t-test. d Autoradiograph of FUS-RNA complexes immunoprecipitated from total cortex and synaptoneurosomes and trimmed by different concentrations of micrococcal nuclease (MNase). The red box indicates the excised part used for preparing CLIP libraries. Cortices from 200 mice were used to prepare synaptoneurosomes and two mice for the total cortex sample. Due to the necessity of this significant upscaling, library preparation and sequencing was not repeated (n = 1). However, immunoprecipitation and autoradiograph has been repeated several times to confirm reproducibility. e MA-plot of CLIPper peaks predicted in the synaptoneurosome CLIP-seq sample. logCPM is the average log2CPM of each peak in the total cortex and synaptoneurosome sample and logFC is the log2 fold-change between the number of reads in the SNS and total cortex sample. The row of points in the upper left corner are peaks with zero reads in the total cortex sample. P-values shown in e, f are computed by likelihood-ration test and unadjusted for multiple comparisons. f Same MA-plot as in e showing the selected, synaptoneurosome-specific peaks (p-value cutoff of 1e-05) in red. g Bar plot with the percentage of synaptoneurosome and total cortex-specific peaks located in exons, 5′UTRs, 3′UTRs or introns. FUS binding in Grin1 (h), Gabra1 (i) in total cortex (green), and SNS (blue). j Schematic with the cellular localization and function of some of the selected FUS targets. k Predicted sequence motifs (HOMER) in windows of size 41 centered on the position with maximum coverage in each peak. Each set of target sequences has a corresponding background set with 200,000 sequences without any CLIP-seq read coverage (they are not bound by FUS/TDP-43). We note that these are all FUS motifs that were marked as true positives by HOMER and that occur in more than 3% of the target sequences, while the top motif is shown for TDP-43. P-values are reported by HOMER (one-sided hypergeometric test).

