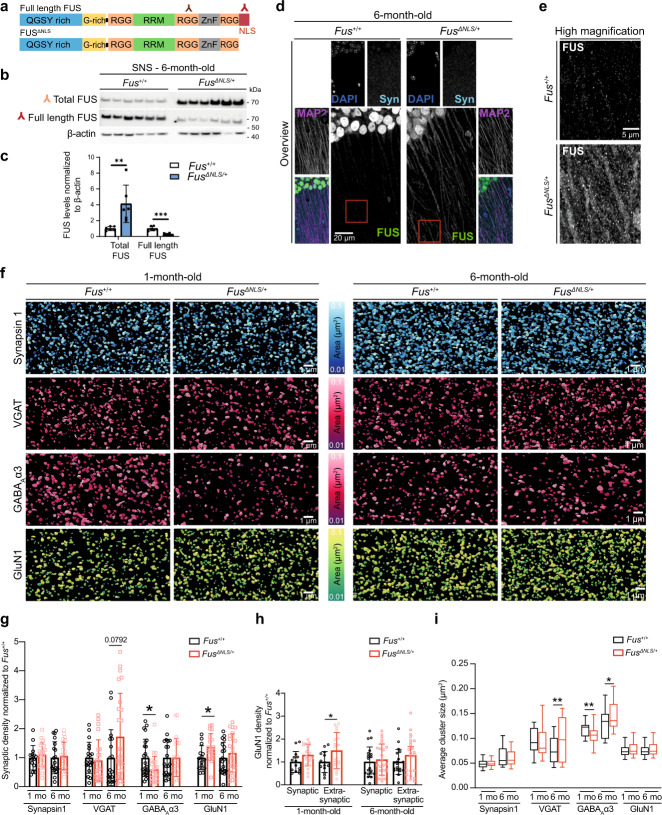
Fig. 3. Increased synaptic FUS localization in FusΔNLS/+ mice is accompanied by alterations in GABAergic synapses.
a Schematic showing specificity of antibodies used for western blot against protein domains of Fused in sarcoma (FUS). b Western blot of total FUS, full-length FUS and actin in synaptoneurosomes isolated from Fus+/+ and FusΔNLS/+ mice at 6 months of age. Source data are provided as a Source Data file. c Quantification of total FUS (p-value = 0.0091) and full-length FUS levels (p-value = 0.001) in synaptoneurosomes from Fus+/+ and FusΔNLS/+ at 6 months of age. Error bars represent mean ± SD. Each dot represents samples prepared from six different mice. n = 6, **p < 0.01, ***p < 0.001, two-tailed, unpaired t-test. d Confocal images of the hippocampal CA1 area from 6-month-old mice showing higher level of FUS in the dendritic tree and synaptic compartment in FusΔNLS/+ mouse model. On the top, low magnification pictures show the dendritic area of pyramidal cells stained with FUS (green), microtubule-associated protein 2 (MAP2) (dendritic marker, magenta), Synapsin 1 (Syn, synaptic marker, Cyan), and DAPI (Blue). Red box indicates the area imaged in the high magnification images below. n = 5 independent Fus+/+ and FusΔNLS/+ mice. e Higher magnification equivalent to the area highlighted in red in d. f Representative images of staining using synaptic markers Synapsin 1, Vesicular GABA transporter (VGAT), postsynaptic GABAergic receptors containing α3 subunit (GABAAα3), and GluN1 (NMDAR submit) in Fus+/+ and FusΔNLS/+ at 1 and 6 months of age. Images were generated with Imaris and display volume view used for quantification with statistically coded surface area. Density and cluster area were analyzed. n = 6 independent Fus+/+ and FusΔNLS/+ mice at 1 month of age. At 6-month-old, n = 5 independent mice for Fus+/+, n = 6 for FusΔNLS/+. g Graph bar representation of the synaptic density of Synapsin 1, VGAT, GABAAα3, and GluN1 from Fus+/+ and FusΔNLS/+ at 1 and 6 months of age. Graph bar showing mean ± SD. *p < 0.05, two-tailed unpaired t-test. Graphs are extracted from the same analysis shown in Supplementary Fig. 3e, f. The statistical analysis can be found in Supplementary data 2. For 1-month-old group, n = 6 independent mice for Fus+/+ and FusΔNLS/+. For 6-month-old group, n = 5 independent mice for Fus+/+, n = 6 for FusΔNLS/+. For Synapsin 1 at 1-month-old, n = 14 fields of view for Fus+/+ and 866013 synapses analyzed, 20 fields of view for FusΔNLS/+ with 1,475,455 synapses analyzed. For Synapsin 1 at 6-month-old n = 19 fields of view for Fus+/+ and 1590276 synapses analyzed, 24 fields of view for FusΔNLS/+ with 2,138,361 synapses analyzed. For VGAT at 1-month-old, n = 19 fields of view for Fus+/+ with 713,918 synapses analyzed, 23 fields of view for FusΔNLS/+ with 782790 synapses analyzed. For VGAT at 6-month-old, n = 18 fields of view for Fus+/+ with 553020 synapses analyzed, 24 fields of view for FusΔNLS/+ with 1,273,325 synapses analyzed. For GABAAα3 at 1-month-old, n = 24 fields of view for Fus+/+ with 1,062,095 synapses analyzed, 24 fields of view for FusΔNLS/+ with 634,958 synapses analyzed. For GABAAα3 at 6-month-old, n = 20 fields of view for Fus+/+ with 726,881 synapses analyzed, 22 fields of view for FusΔNLS/+ with 804,732 synapses analyzed. For GluN1 at 1-month- old, n = 14 fields of view for Fus+/+ with 704,322 synapses analyzed, 20 fields of view for FusΔNLS/+ with 1,379,868 synapses analyzed. For GluN1 at 6-month-old, n = 19 fields of view for Fus+/+ with 1,267,271 synapses analyzed, 24 fields of view for FusΔNLS/+ with 1,866,397 synapses analyzed. h Colocalization analysis of GluN1 with Synapsin 1 to identify synaptic NMDAR (GluN1) and extrasynaptic NMDAR. Results were normalized by the control of each group. Graph bar showing mean ± SD. *p < 0.05., two-tailed unpaired t-test. ‘n’ values are as indicated in g. i Box and Whiskers representation (centered on the median with min to max value) of the average cluster area for each marker (Synapsin 1, VGAT, GABAAα3, and GluN1) from 1-month and 6-month-old Fus+/+ and FusΔNLS/+ mice. Box showing Min to Max, *p < 0.05 **p < 0.01, two-tailed, unpaired t-test. ‘n’ values are as indicated in g. Graphs are extracted from the same analysis shown in Supplementary Fig. 3f–i. The statistical analysis can be found in Supplementary data 3.

