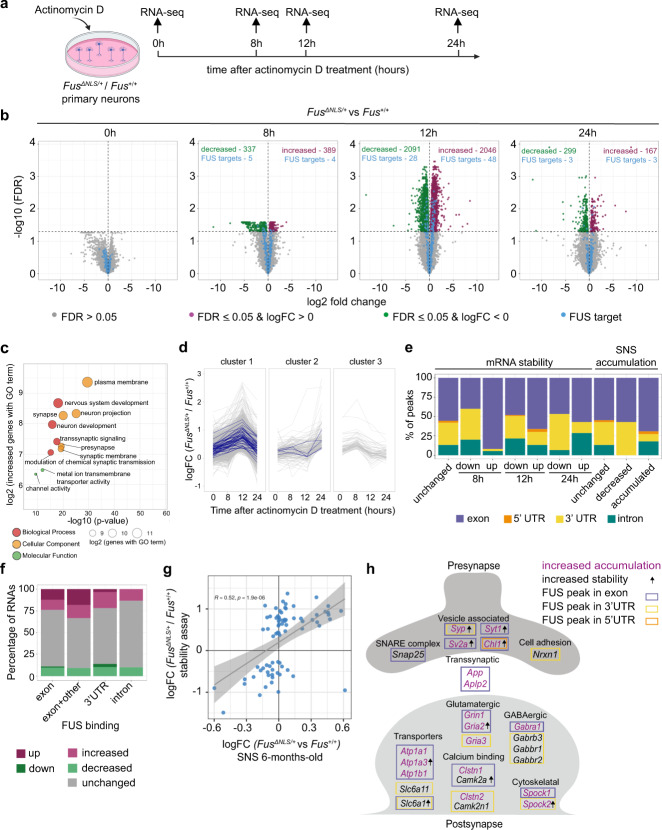
Fig. 5. Cytoplasmic FUS accumulation in FusΔNLS/+ neurons leads to increased stability of synaptic mRNAs.
a Workflow of the RNA stability experiment. b Volcano plots showing the log2 fold change of each mRNA and the corresponding −log10 (FDR) of the differential gene expression analysis comparing FusΔNLS/+ to Fus+/+ samples at each time point with significance threshold 0.05 (horizontal line). Significantly decreased mRNAs are highlighted in green, increased in purple and all synaptic FUS targets identified in the CLIP-seq data in blue. c Selected GO terms enriched in the set of significantly increased mRNAs at 12 h. One-sided hypergeometric test, p-value unadjusted for multiple comparisons. d Hierarchical clustering of the log fold changes of the set of increased mRNAs to three groups. The x-axis shows the time points and the y-axis the logFC (FusΔNLS/+/Fus+/+); synaptic FUS targets are highlighted in blue. e Bar plot of different sets of synaptic FUS targets and the location of synapse-specific peaks in these genes. FUS targets with no stability change in FusΔNLS/+ compared to Fus+/+ (unchanged) and the sets of significantly changed mRNAs (up or down) at 8, 12, and 24 h after treatment. The three rightmost bars comprise the FUS targets with no change in synaptoneurosomes (SNS) at 6-months (unchanged), accumulated and decreased targets. f Bar plot of FUS targets grouped by binding location and the percentage of targets with a specific RNA level change. Targets with the majority of peaks in exons (exon), equal number of peaks in exons and UTR/intron (exon + other), majority of peaks in 3′UTR (3′UTR) and majority of peaks in introns (intron). Accumulated RNAs in 6-month-old SNS (up), RNAs with increases stability (increased), unchanged RNA levels (unchanged), less abundant RNAs in 6-month-old SNS (down) and less stable RNAs (decreased). g Log2 fold change (FusΔNLS/+/Fus+/+) of the stability experiment at 12 h (y-axis) and SNS of 6-month-old mice (x-axis) for all synaptic FUS targets with significant changes in stability at 12 h (blue points, n = 76 mRNAs). R = Pearson correlation coefficient, p = p-value (two-sided Pearson correlation test), linear fit (gray line) and 95% confidence interval (gray region). h Summary of the observed changes for selected synaptic FUS targets. RNAs that were accumulated in synaptoneurosomes of 6-month-old FusΔNLS/+ mice are highlighted in magenta; RNAs with increased stability at any time point are indicated by a small arrow; the colored boxes indicate the location of the synaptoneurosome-specific FUS peaks.

