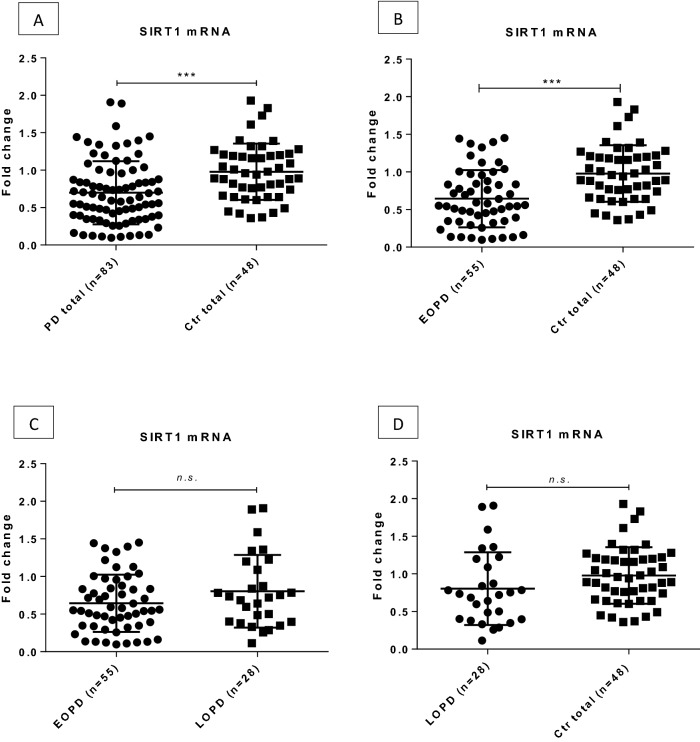
Figure 2.
Expression level of SIRT1 in the peripheral blood of PD patients and healthy controls. Significant down-regulation of SIRT1 expression was measured in PD group compared to controls (A), and in EOPD patients compared to controls (B) as well. No significant difference was detected in the case of EOPD vs. LOPD (C) and LOPD vs. control group (D) comparisons. Fold changes are shown with standard deviation. PD Parkinson’s disease, Ctrl control, EOPD early onset Parkinson’s disease, LOPD late onset Parkinson’s disease, n.s. non-significant; ***p < 0.001 after FDR correction.

