Figure 1.
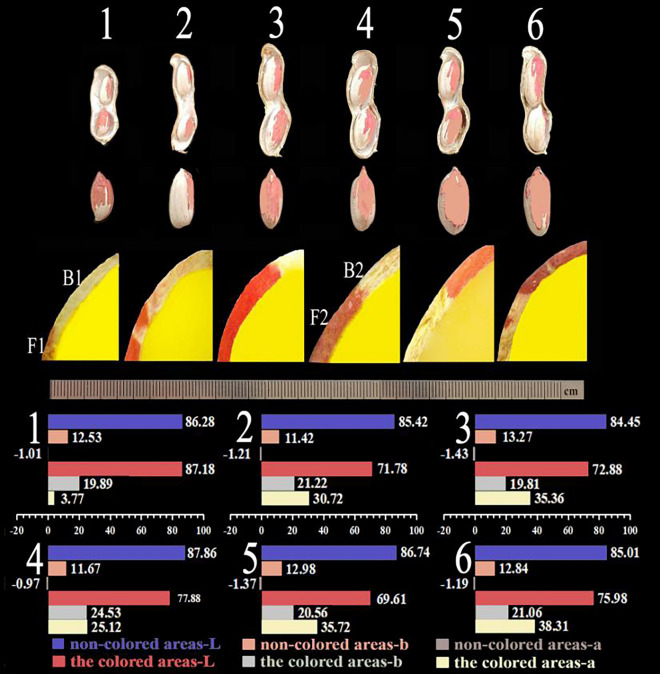
Phenotype and chromatic changes in the synthesis of color in the variegated peanut testa: Numbers 1–6: day at flowering and needling (DAF) 30, 35, 40, 45, 50, and 55 days. F1 and F2 represent the sample names of the pigmented areas at DAF30 and DAF45, respectively. B1 and B2 represent the sample names of the non-pigmented areas at DAF30 and DAF45, respectively. Bar colors represent different values of “a”, “b”, and “L”. The absorbance value “a” (“a” value) represents red and green; the absorbance value “b” (“b” value) represents yellow and blue; and the “L” value represents lightness.

