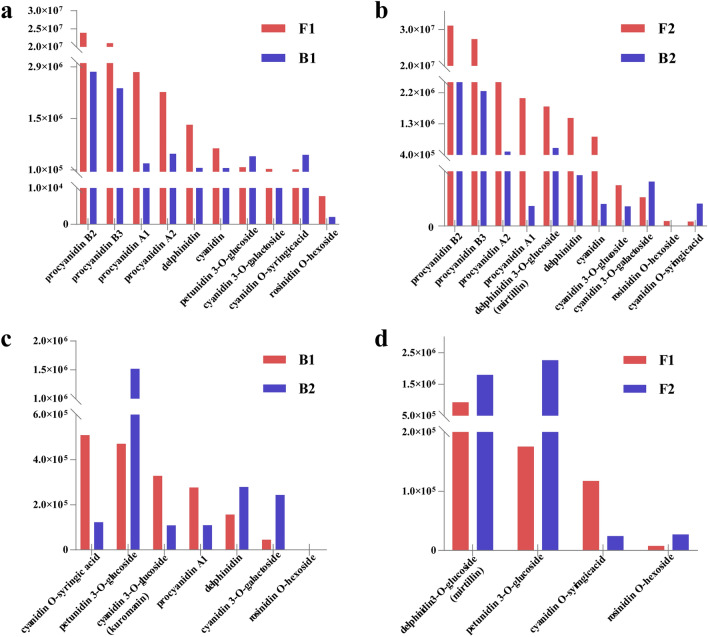
Figure 2.
Types and relative contents of flavonoids in different areas of peanut testa at different developmental stages. (a, b) represent the type and content differences of metabolized flavonoids between the pigmented and non-pigmented areas after DAF30 and DAF45, respectively. (c) represents the different metabolized flavonoid types and content in the non-pigmented areas after DAF30 and DAF45. (d) represents the different metabolized flavonoid types and content in the pigmented areas at DAF30 and DAF45. The horizontal axis represents the types of flavonoids in the variegated testa and the vertical axis represents the peak areas value determined by the LC–MS/MS detection platform.

