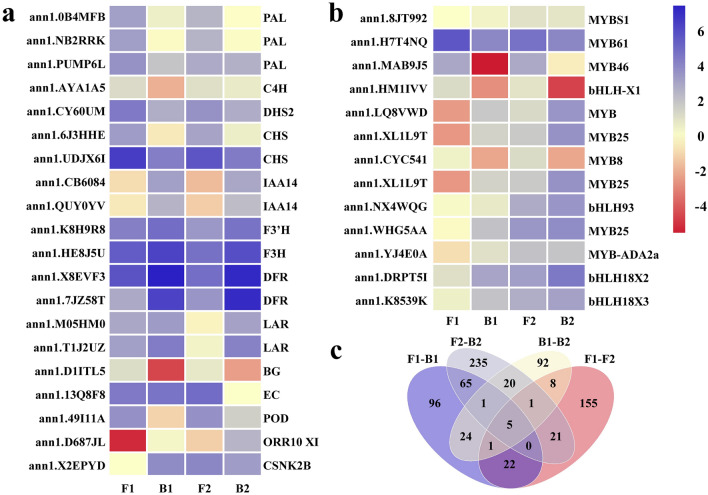
Figure 7.
(a, b) Heat map of the DEGs related to anthocyanin synthesis in the variegated peanut testa among different comparison groups of structural genes and transcription factors. Gene expression was scaled in this analysis using FPKM (Fragments Per Kilobase of exon model per Million mapped fragments) Z-scores based on the mean value of two biological replicates in the heatmap. The key is located on the right-hand side in each case with FPKM values increasing from blue to orange. (c) The Venn diagram of the DEGs among different comparison groups.

