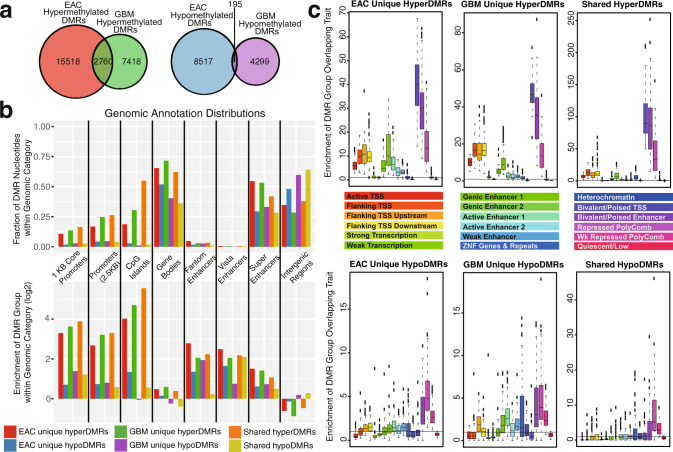
Fig. 1. Comparative analysis of EAC and GBM DNA methylation abnormalities.
a Overlap of 500 bp differentially methylated regions (DMRs) in EAC and GBM. Left: hypermethylated DMRs; right: hypomethylated DMRs. Both overlaps are significant (p < 2.2E − 308 and p < 6.0E − 199, respectively, hypergeometric tests). b Genomic annotation distribution of EAC and GBM DMRs. Top: percentage of DMR group nucleotides within each genomic category. Bottom: enrichment of DMR group nucleotides within each genomic category. c EAC and GBM DMR enrichment within epigenetic annotations (chromHMM 18-states) across a variety of cell and tissue types (n = 80, Human Roadmap Epigenome32). For each DMR group, the percentage of base pairs (bps) that overlapped each epigenetic state in each of the cell/tissue types was calculated, and enrichment scores were calculated by dividing those percent overlaps by the percentage of background bps that overlapped each epigenetic state in each cell/tissue type. Background regions considered when calculating enrichment in both b and c were 500 bp genomic regions that excluded chromosome ends, excluded bins overlapping blacklisted CpGs, excluded bins not containing at least one MeDIP and/or MRE read for at least one sample, excluded bins not containing at least one CpG, and excluded those on chrY (and chrX for GBM).

