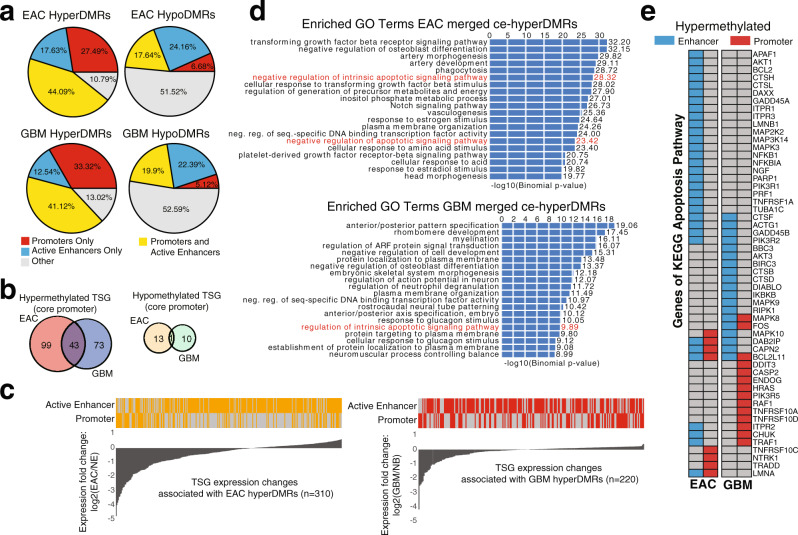
Fig. 2. EAC and GBM DMRs show similar characteristics on a pathway level.
a Percentage of DMRs with active regulatory annotations (promoter and/or active enhancer) in EAC and GBM. b Overlap of tumor suppressor genes (TSGs) with abnormally methylated core promoters (1 kb, centered around TSS) in EAC and GBM. Left: hyperDMRs (overlap is significant: p < 8.39E − 14, hypergeometric test); right: hypoDMRs. c TSGs with abnormally methylated promoters (1 kb, centered around the TSS) and/or active enhancers in EAC (left) and GBM (right), accompanied by fold change in expression of TSGs in EAC and GBM. NB: normal brain; NE: normal endometrium. Orange and red bars indicate the presence of a DMR within an active enhancer/promoter in EAC and GBM hyperDMRs, respectively. d Top enriched GO terms (Biological Process) of ce-hyperDMRs in EAC (top) and GBM (bottom). Values represent the −log10(Binomial p-value). e Hypermethylation status of apoptosis gene promoters (red) and enhancers (blue) in EAC (left) and GBM (right).

