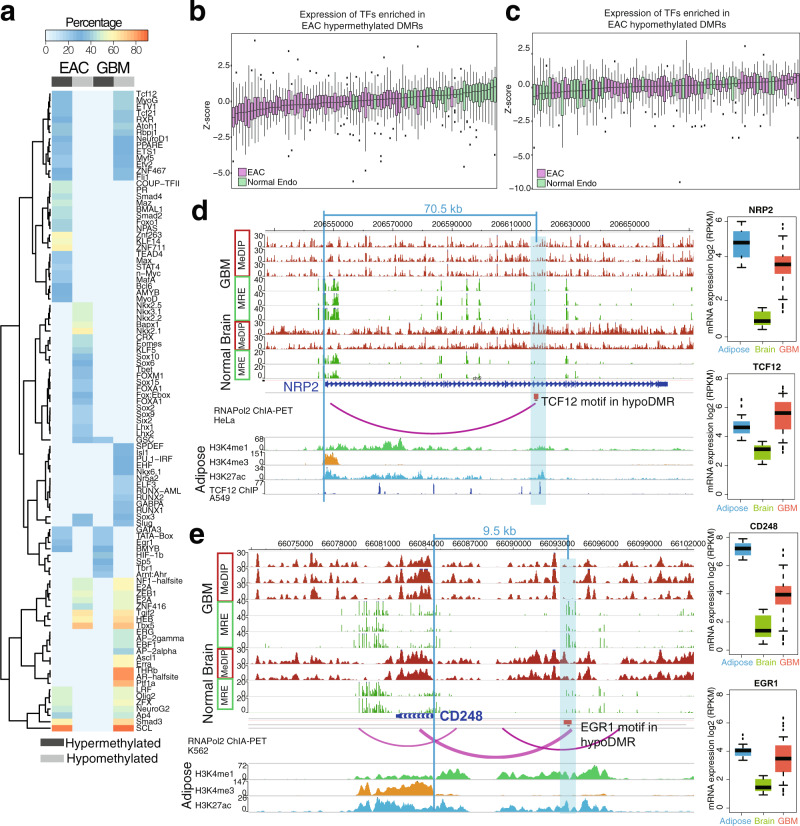
Fig. 3. Abnormally methylated enhancer-potential regions in cancer are associated with deregulated transcription factors.
a Percentage of EAC and GBM DMRs with enriched transcription factor-binding motifs. Only those with a q-value ≤ 0.01 and percentage ≥ 20% are shown. b, c Normalized expression (RPKM, z-scores) of TFs enriched in EAC ce-hyperDMRs (b, number of EAC samples = 57, number of normal endometrial samples = 29, number of TFs = 30) and ce-hypoDMRs (c, number of EAC samples = 57, number of normal endometrial samples = 29, number of TFs = 21) in normal endometrium (green) and EAC (purple) samples. d Epigenome Browser74,75 view demonstrating a hypoDMR (blue highlighted region) across GBM samples within the NRP2 gene. The DMR contains a TCF12-binding motif, as evidenced by a ChIP-seq peak for the TF in A549 cells, which demonstrates interaction with the NRP2 promoter in HeLa cells. TCF12 is relatively unexpressed in brain (frontal cortex, n = 28), but more highly expressed in adipose tissue (subcutaneous, visceral, n = 1204) where it also bears the marks of an active enhancer (H3K4me1 and H3K27ac, lacking H3K4me3). Expression of TCF12 increases in GBM (n = 160), accompanying an increase in the presumed target gene NRP2’s expression, as also seen in adipose tissue. MeDIP and MRE tracks depict raw read data. e Epigenome Browser74,75 view demonstrating a hypoDMR (blue highlighted region) across GBM samples upstream of the CD248 gene. The DMR contains an EGR1-binding motif that demonstrates interaction with the CD248 promoter in K562 cells. EGR1 is relatively unexpressed in brain (frontal cortex, n = 28), but more highly expressed in adipose tissue (subcutaneous, visceral, n = 1204) where it also bears the marks of an active enhancer (H3K4me1 and H3K27ac, lacking H3K4me3). Expression of EGR1 increases in GBM (n = 160), accompanying an increase in the presumed target gene CD248’s expression, as also seen in adipose tissue. MeDIP and MRE tracks depict raw read data.

