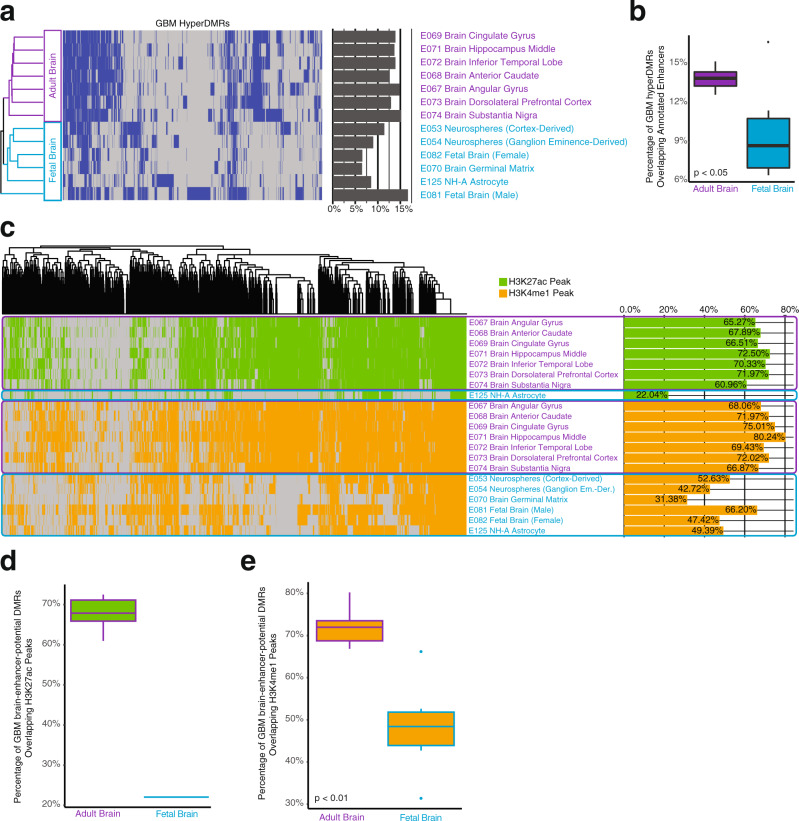
Fig. 5. GBM hyperDMRs possess enhancer chromatin marks in adult brain tissues.
a Enhancer annotation (chromHMM 15-state model annotation “7_Enh”32) presence or absence in GBM hyperDMRs in fetal (n = 6, light blue) and adult brain (n = 7, purple) tissue/cells32 (heatmap colors: blue: enhancer annotation present in DMR; gray: enhancer annotation absent in DMR). Bar plot indicates the fraction of all GBM hyperDMRs overlapping enhancer annotations in each cell/tissue type. b Boxplot depicting the distribution of fractions of GBM hyperDMRs overlapping enhancer annotations, comparing adult (n = 7) and fetal (n = 6) brain tissues (t-test, p < 0.05). c H3K27ac (green) and H3K4me1 (orange) peak occupancy within GBM enhancer-potential hyperDMRs (GBM hyperDMRs overlapping an enhancer annotation in at least one adult or fetal brain tissue) across fetal (n = 1 and 6, for H3K27ac and H3K4me1, respectively, light blue) and adult (n = 7 for both H3K27ac and H3K4me1, purple) brain tissues. Bar plot indicates the fraction of all GBM enhancer-potential hyperDMRs that contained H3K27ac peaks or H3K4me1 peaks in each cell/tissue type. d Boxplot depicting fractions of GBM enhancer-potential hyperDMRs overlapping H3K27ac peaks in adult brain tissues (n = 7, left) and horizontal line depicting the fraction of GBM enhancer-potential hyperDMRs overlapping H3K27ac peaks in fetal brain (n = 1, right). e Comparison of the proportions of GBM enhancer-potential hyperDMRs overlapping H3K4me1 peaks in adult brain tissues (n = 7, left) to the proportions of GBM enhancer-potential hyperDMRs overlapping H3K4me1 peaks in fetal brain tissues (n = 6, right) (t-test, p < 0.01).

