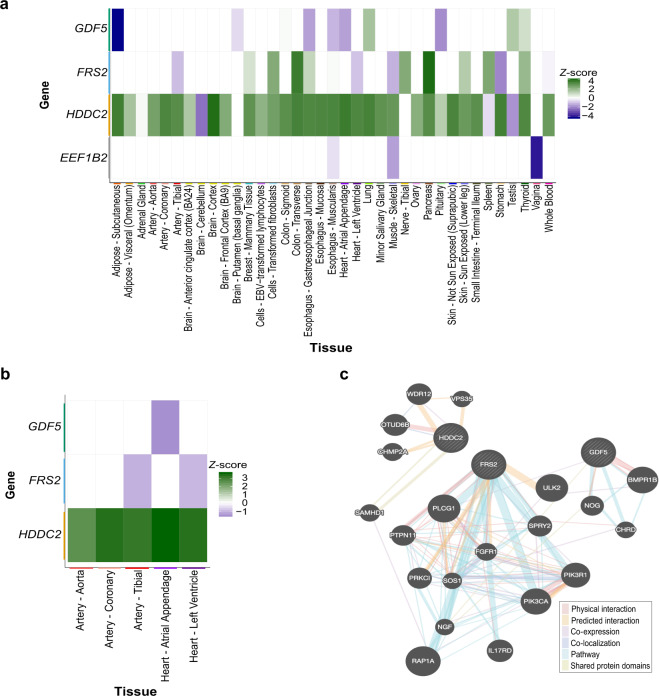
Fig. 2. ACT TWAS identifies novel candidate genes based on expression profiles.
a Analysis of diverse tissues identified four genes that passed an FDR correction for multiple testing in the TWAS and indicate that expression may modify ACT risk. Gene-level Z-scores, reflecting the number of standard deviations the mean expression of the gene (adjusted for the weight of each eQTL influencing expression of the gene) in ACT cases is from that of controls, across tissues where these genes were detected are plotted. b Association of top TWAS associated genes in tissues most relevant for ACT (i.e. heart and arterial). Z-score > 0 (green) indicates increased expression in ACT cases, while Z-score < 0 (purple) indicates decreased expression in these patients. c Gene interaction networks for the top TWAS associated genes identified using GeneMANIA.

