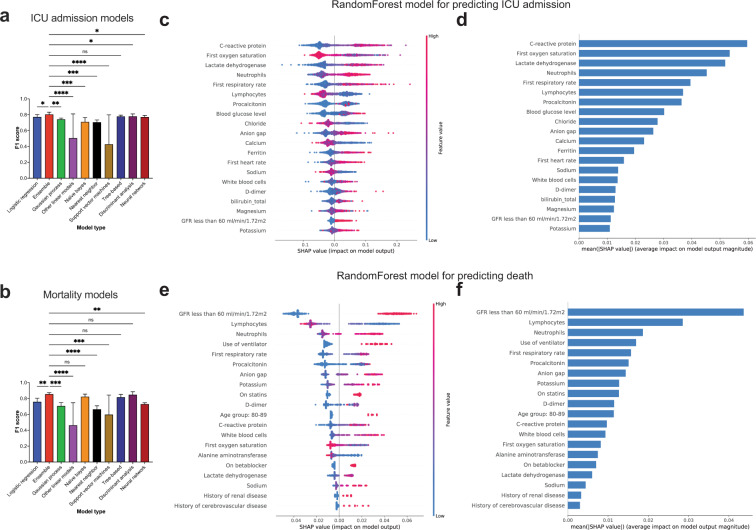
Fig. 2. F1 score comparison and variables of importance for ICU admission and mortality prediction models.
a, b Bar plots representing the F1 scores of ICU admission and mortality prediction models. Error bars indicate standard deviation from mean. Statistical analysis was performed using Two-stage step-up method of Benjamini, Krieger and Yekutieli test which controls for False discovery rate (FDR) during multiple comparison. p-value style is geometric progression - <0.03 (*), <0.002 (**), <0.0002 (***), <0.0001 (****). c SHAP value summary dot plot and d variable importance of RandomForest algorithm-based ICU admission model. e SHAP value summary dot plot and f variable importance of RandomForest algorithm-based mortality model. The calculation of SHAP values is done by comparing the prediction of the model with and without the feature in every possible way of adding the feature to the model. The bar plot depicts the mean SHAP values whereas the summary dot plot shows the impact on the model. The color of the dot represents the value of the feature and the X-axis depicts the direction and magnitude of the impact. Red colored dots represent high value of the feature and the blue represents lower value. A positive SHAP value means the feature value increases likelihood of ICU admission/mortality. For features with positive SHAP value for red dots, suggests directly proportional variable to outcome of interest and those with positive SHAP value for blue dots, suggest inverse correlation.

