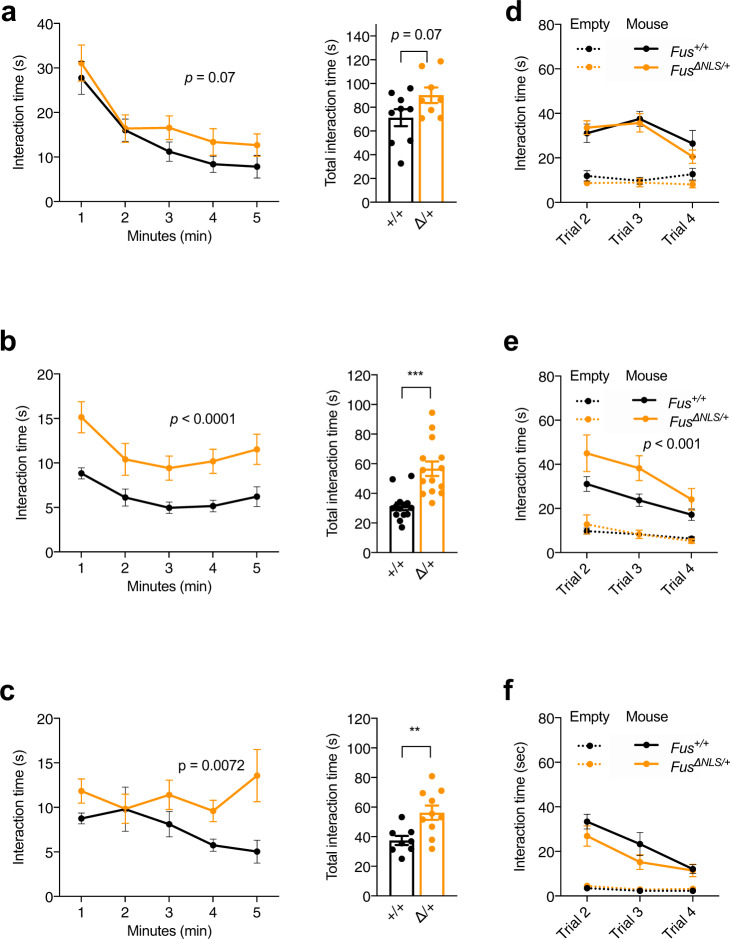
Fig. 2. Social behavior abnormalities in FusΔNLS/+ mice.
a–c Line and bar graphs represent interaction time between resident (test) and intruder mice exclusively initiated by resident mouse in one-minute intervals (line graphs, on the left) or over the total time (bar graphs, on the right) during a 5 min resident-intruder test in home cage for 4 (a), 10 (b), and 22 (c) months-old Fus+/+ (black) and FusΔNLS/+ (orange) male mice. Note that, young FusΔNLS/+ mice demonstrated a trend towards an increased social interest for intruder mouse (a) while older mice interacted with intruders significantly longer then Fus+/+ (b, c) showing an age-dependent impairment of social behavior–disinhibition. All values are represented as mean ± SEM. At 4 months, N = 9 for Fus+/+ and N = 8 for FusΔNLS/+ mice; At 10 months, N = 14 for Fus+/+ and N = 14 for FusΔNLS/+ mice; At 22 months, N = 8 for Fus+/+ and N = 10 for FusΔNLS/+ mice. Two-way repeated measures ANOVA followed by Sidak post-hoc test (p = 0.07 (4 months), p < 0.001 (10 months), and p = 0.007 (22 months) for genotype.effect); Two-sided Unpaired Student’s t-test for total time p = 0.07 (4 months), p < 0.001 (10 months), and p = 0.007 (22 months)). d, f Line graphs represent sociability in the three-chamber test measured as interaction time with novel mice across three trials for Fus+/+(black) and FusΔNLS/+ (orange) male mice at 4 (d), 10 (e), and 22 (f) months of age. Time exploring an empty cage (object) across trials is represented as dashed lines. At 4 months, N = 9 for Fus+/+ and N = 8 for FusΔNLS/+ mice; At 10 months, N = 14 for Fus+/+ and N = 14 for FusΔNLS/+ mice; At 22 months, N = 8 for Fus+/+ and N = 9 for FusΔNLS/+ mice. Data are presented as mean ± SEM. Three-way ANOVA with Newman Keuls post-hoc test for multiple comparisons, p = ns (4 months), p < 0.001 (10 months) and p = ns (22 months) for genotype effect). Source data are provided as a Source Data file.

