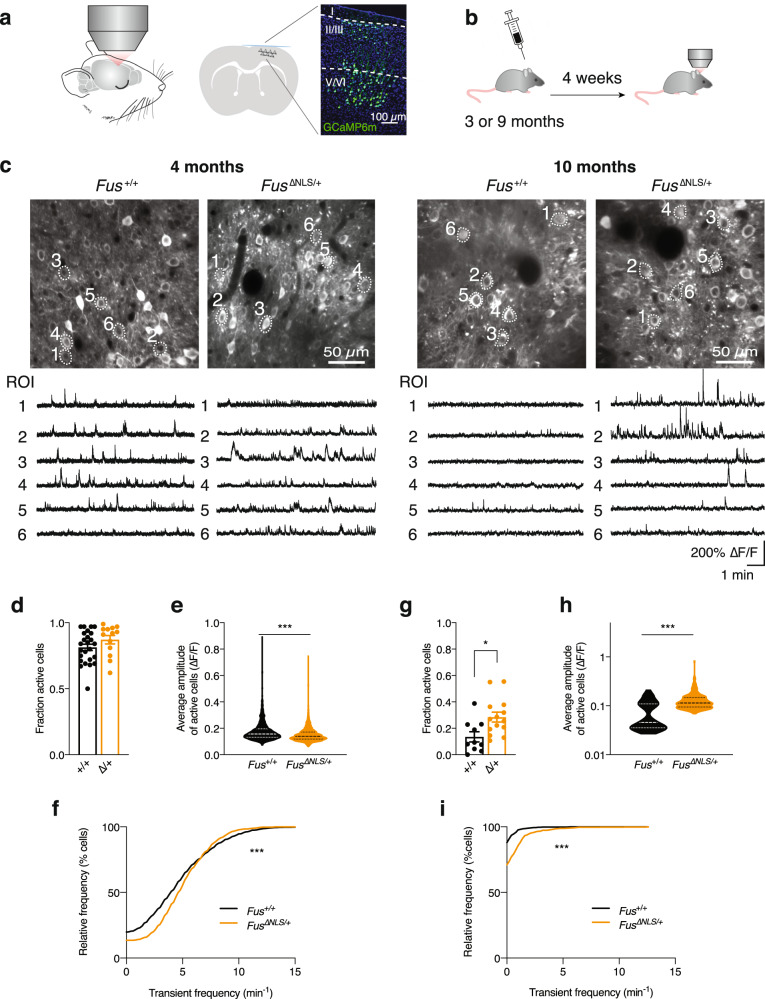
Fig. 3. Assessment of neuronal activity in FusΔNLS/+ mice in vivo.
a Neuronal activity was monitored in frontal cortex of anesthetized mice. Scheme of coronal section, indicating the expression of GCaMP6s in cortex assessed through a cranial window. Magnified view of imaged cortical area demonstrates neuronal expression of GCaMP (green) across all cortical layers. b Timeline of experiments. Male and female mice were injected with AAV9-syn-jGCaMP7s (at 3 months of age) or AAV2/1-hsyn-GCaMP6m (at 9 months of age) into frontal cortex and implanted with a cranial window. In vivo imaging began 4 weeks after implantation. c Representative examples (average projections) of field of views (FOV) imaged in Fus+/+ and FusΔNLS/+ mice at 4 months (N = 8 Fus+/+ mice and N = 3 FusΔNLS/+ mice, left) and at 10 months (N = 5 Fus+/+ mice and N = 6 FusΔNLS/+ mice, right) are shown together with fluorescence calcium traces of selected regions of interest (ROIs). d The fraction of active cells per FOV was not affected in 4-month-old FusΔNLS/+ mice. N = 13 FOVs in 3 FusΔNLS/+ and N = 25 FOVs in 8 Fus+/+ mice. Data are presented as mean ± SEM p = 0.1627, Two-sided Unpaired Student’s t-test. e, f The calcium transient frequencies (e) were increased while the average transient amplitudes (f) were decreased in FusΔNLS/+ mice. N = 1107 ROIs in 3 FusΔNLS/+ and N = 2264 ROIs in 8 Fus+/+, superimposed by the median (e). Kolmogorov–Smirnov test, ***p < 0.0001 for both panel e and f. g–i The fraction of active cells per FOV (g) as well as (h) the frequencies and (i) the average amplitudes of calcium transients of each ROI were increased in 10-month-old FusΔNLS/+ mice. Data are individual FOVs (g; N = 14 FOVs in 6 FusΔNLS/+ and N = 10 FOVs in 5 Fus+/+ mice) or individual ROIs (h, i; N = 855 ROIs in 6 FusΔNLS/+ and N = 631 ROIs in 5 Fus+/+ mice) superimposed by the mean ± SEM (g) or the median (h, i). panel g: Two-tailed Unpaired Student’s t-test, *p = 0.0126; panel h and i: Kolmogorov–Smirnov test, ***p < 0.0001 for both panels. Source data are provided as a Source Data file.

