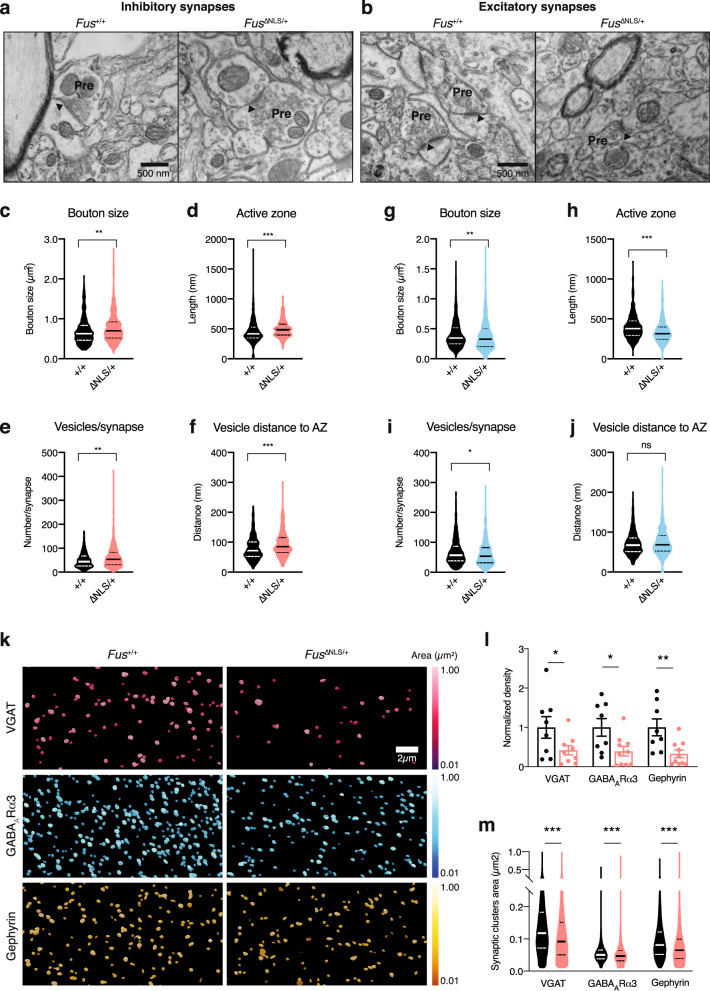
Fig. 6. Defects in synapses in 22-months-old FusΔNLS/+ mice.
a, b Representative image of transmission electron microscopy in Fus+/+ or Fus∆NLS/+ layer II/III of the motor cortex at 22 months of age showing inhibitory synapses (a) (as containing ≥1 mitochondrion on each side of the synapse) and excitatory synapses (b). Pre: presynaptic compartment; active zone is shown with an arrowhead. N = 4 Fus+/+ mice (1 male and 3 females), and N = 4 FusΔNLS/+ mice (1 male and 3 females) have been analyzed. c–f Violin plot showing the distribution of bouton sizes (c), the length of active zones (d), the number of vesicles per synapse (e), and the distance of individual vesicles to the active zone (f) in inhibitory synapses of Fus+/+ (black) or Fus∆NLS/+ (orange) mice. For panels c–f, N = 379 synapses from 1 male and 3 female Fus+/+ mice and N = 387 synapses from 1 male and 3 female Fus∆NLS/+ mice were analyzed. Kolmogorov–Smirnov test. c: p = 0.0016; d: p < 0.0001; e: p = 0.0010; f: p < 0.0001. g–j Violin plot showing the distribution of bouton size (g), the length of active zone (h), the number of vesicles per synapse (i), and the distance of individual vesicles to the active zone (j) in excitatory synapses of Fus+/+ (black) or Fus∆NLS/+ (cyan) mice. For panels g–j, N = 463 synapses from 1 male and 3 female Fus+/+ mice and N = 490 synapses from 1 male and 3 female Fus∆NLS/+ mice were analyzed. Kolmogorov–Smirnov test. g: p = 0.0038; h: p < 0.0001; i: p = 0.0362; j: p = 0.2182. k Representative images of GABAARα3, Gephyrin and VGAT intensity in 22-months male mice, coded by area size (Imaris). N = 3 Fus+/+ mice and N = 4 FusΔNLS/+ mice have been analyzed. l Bar graphs representing the density analysis for VGAT, GABAARα3, and Gephyrin comparing Fus+/+ vs Fus∆NLS/+ mice. (Fus+/+ vs Fus∆NLS/+, Mann–Whitney test, VGAT, p = 0.0464; GABAARα3, p = 0.0217; Gephyrin, p = 0.0043). N = 8 FOVs from 3 Fus+/+ mice and N = 9 FOVs from 4 Fus∆NLS/+ mice were analyzed for VGAT; N = 8 FOVs from 3 Fus+/+ mice and N = 10 FOVs from 4 Fus∆NLS/+ mice were analyzed for GABAARα3 and Gephyrin. Data are presented as mean ± SEM. Mann–Whitney, One tailed, VGAT: p = 0.0464; GABAARα3: p = 0.0217; Gephyrin: p = 0.0043. m Violin plot representing the analysis of the clusters size for VGAT, GABAARα3, and Gephyrin comparing Fus+/+ vs Fus∆NLS/+ mice. N = 142,416 synapses from 3 Fus+/+ mice and N = 115,151 synapses from 4 Fus∆NLS/+ mice were analyzed for VGAT; N = 202,302 synapses from 3 Fus+/+ mice and N = 99,464 synapses from 4 Fus∆NLS/+ mice were analyzed for GABAARα3; N = 169,036 synapses from 3 Fus+/+ mice and N = 68,422 synapses from 4 Fus∆NLS/+ mice were analyzed for Gephyrin. Kolmogorov–Smirnov test. VGAT: p < 0.0001; GABAARα3: p < 0.0001; Gephyrin: p < 0.0001. Source data are provided as a Source Data file.

