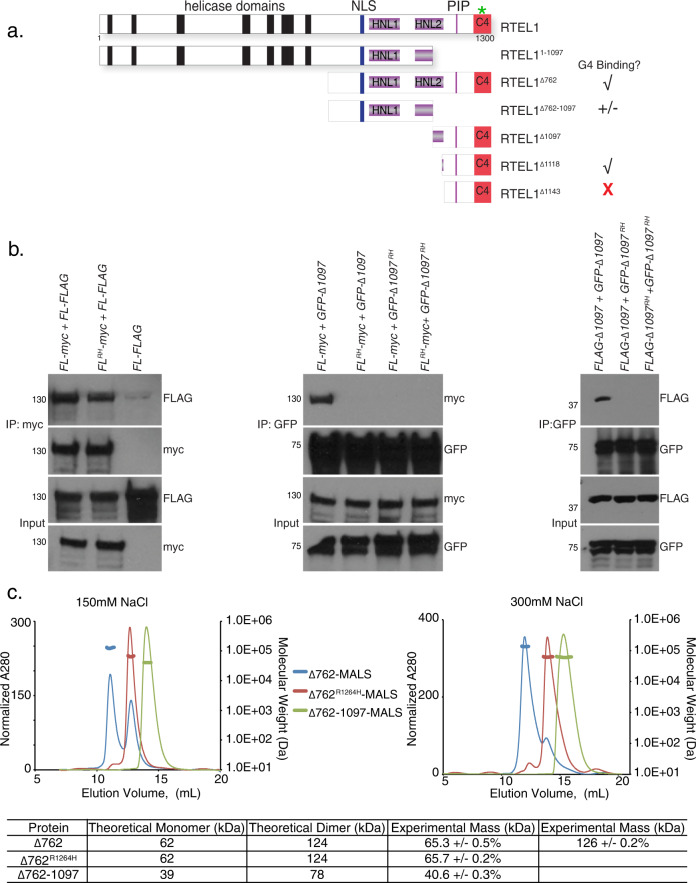
Fig. 1. Domain Analysis of RTEL1.
a Schematic representation of RTEL1 proteins and constructs used in this study. The location of the RTEL1R1264H mutation is indicated with a green star and G4 binding is illustrated. b RTEL1 interacts with itself in cells and the RTEL1R1264H mutation disrupts interactions within the RING domain. Left, Myc immunoprecipitations from HEK293T cells co-expressing FLAG and myc-tagged RTEL1 (FL) and RTEL1R1264H (FL RH) were carried out. Immunoblotting with FLAG indicates co-IP of both RTEL1 and RTEL1R1264H. Center, immunoblotting with myc indicates co-IP of RTEL1∆1097 (∆1097), but not RTEL1∆1097 R1264H (∆1097 RH) with GFP-tagged RTEL1 and RTEL1R1264H. Right, immunoblotting with FLAG shows co-IP of RTEL1∆1097, but not RTEL1∆1097R1264H. Molecular weight markers, KDa are shown. All immunoblotting experiments were repeated at least three times with similar results. c Oligomeric states of RTEL1 proteins were determined by SEC-MALS analysis of RTEL1∆762 (blue), RTEL1∆762R1264H (red), and RTEL1∆762-1097 (green) at 150 and 300 mM NaCl. Normalized A280 are shown and the calculated molecular mass is shown as a line in the corresponding color across each peak with the secondary scale on the right. The expected and calculated molecular weights are shown (see also Supplementary Fig. 1).

