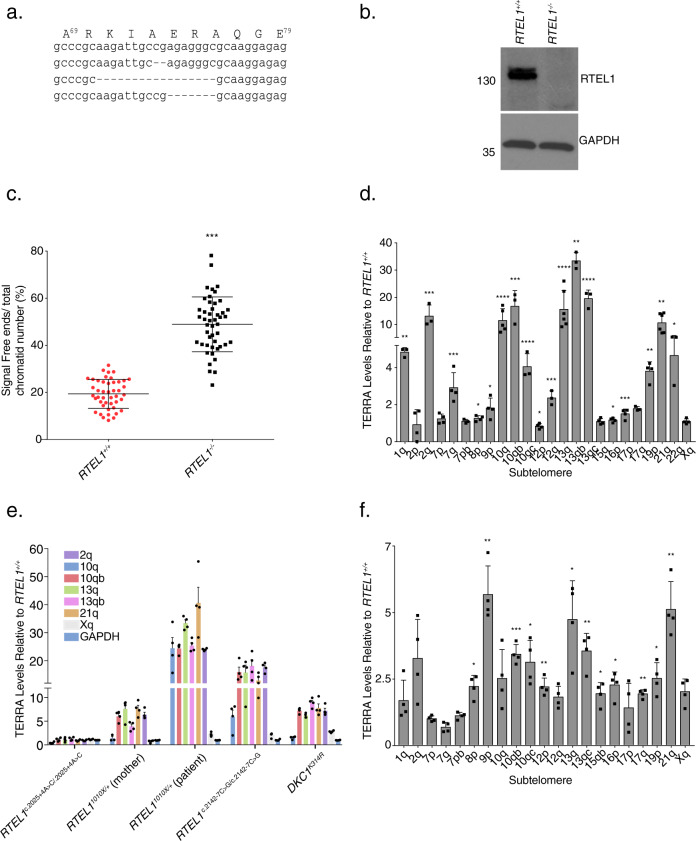
Fig. 3. RTEL1 Influences TERRA Levels.
a Sequence alignment of the PCR products amplified from the HEK293 cells genomic segment of RTEL1 targeted by sgRNA revealing disruption of the coding sequence (exon #2 of RTEL1). b Western blot of RTEL1 protein levels in wild type and RTEL1 knockout HEK293 cells. Molecular weight markers, KDa are shown. Immunoblotting experiments were repeated at least three times producing similar results. c Quantification of telomere loss per chromatid. Data represents the average of at least 50 metaphases as mean and standard deviation (***p < 0.001, two-sided t-test). d TERRA levels at specific chromosome ends are elevated in RTEL1 deficient cells. Bars represent the relative TERRA expression measured by qRT-PCR at 18 chromosome ends. Values are sample averages of at least four experimental repeats (*p < 0.05, **p < 0.01, ***p < 0.001, ****p < 0.0001, two-sided t-test). e TERRA levels are elevated in cells from a panel of patient derived LCL lines. TERRA levels were measured by qRT-PCR. Values are sample averages of at least three experimental repeats and p-values are listed in Supplementary Fig. 9E (*p < 0.05, **p < 0.01, ***p < 0.001, ****p < 0.0001, two-sided t-test). f TERRA levels are elevated in a fibroblast cell line derived from a HHS patient homozygous for the RTEL1R1264H allele. TERRA levels were measured by qRT-PCR. Values are sample averages of at least three experimental repeats (*p < 0.05, **p < 0.01, ***p < 0.001, ****p < 0.0001, two-sided t-test) (see also Supplementary Fig. 9). For qRT-PCR means and standard deviations are shown.

