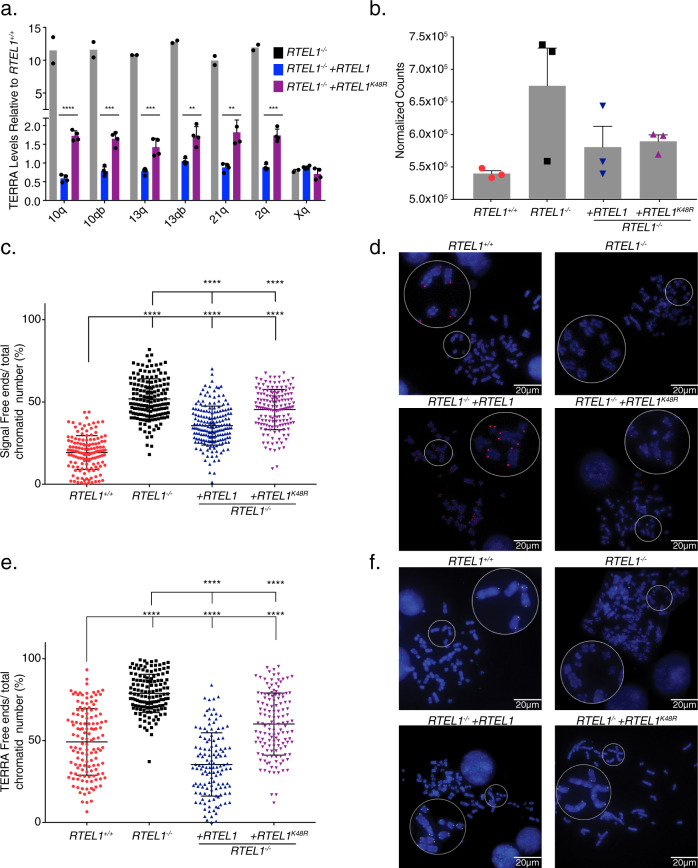
Fig. 4. RTEL1 Influences TERRA Localization.
TERRA levels are rescued upon RTEL1 complementation. a TERRA levels for four upregulated chromosome ends in the RTEL1-KO cell line were tested in cells complemented with FLAG-RTEL1 and a catalytic site mutant FLAG-RTEL1K48R. Bars represent the relative TERRA expression measured by qRT-PCR in three independent experiments (*p < 0.05, **p < 0.01, ***p < 0.001, ****p < 0.0001, two-sided t-test) and mean and standard deviation is shown. b Total subtelomeric counts determined by RNA-seq experiments in the cell lines specified in a. Mean + /− SEM is shown. c Quantification of telomere loss per chromatid in FLAG-RTEL1 and FLAG-RTEL1K48R reconstituted cell lines by telomere FISH. d Representative telomere FISH images are shown with zoomed-in section (large white circle for zoom of small white circle). e Quantification of TERRA loss per chromatid in FLAG-RTEL1 and FLAG-RTEL1K48R reconstituted cell lines by TERRA FISH. f Representative TERRA FISH images are shown with zoomed-in section (large white circle for zoom of small white circle). Data for both TERRA and Telomere FISH experiments represent the average of at least 50 metaphases in each of three independent experiments and three independent reconstitutions shown as the mean and standard deviation (*p < 0.05, **p < 0.01, ***p < 0.001, ****p < 0.0001, two-sided t-test) (see also Supplementary Figs. 8 and 9).

