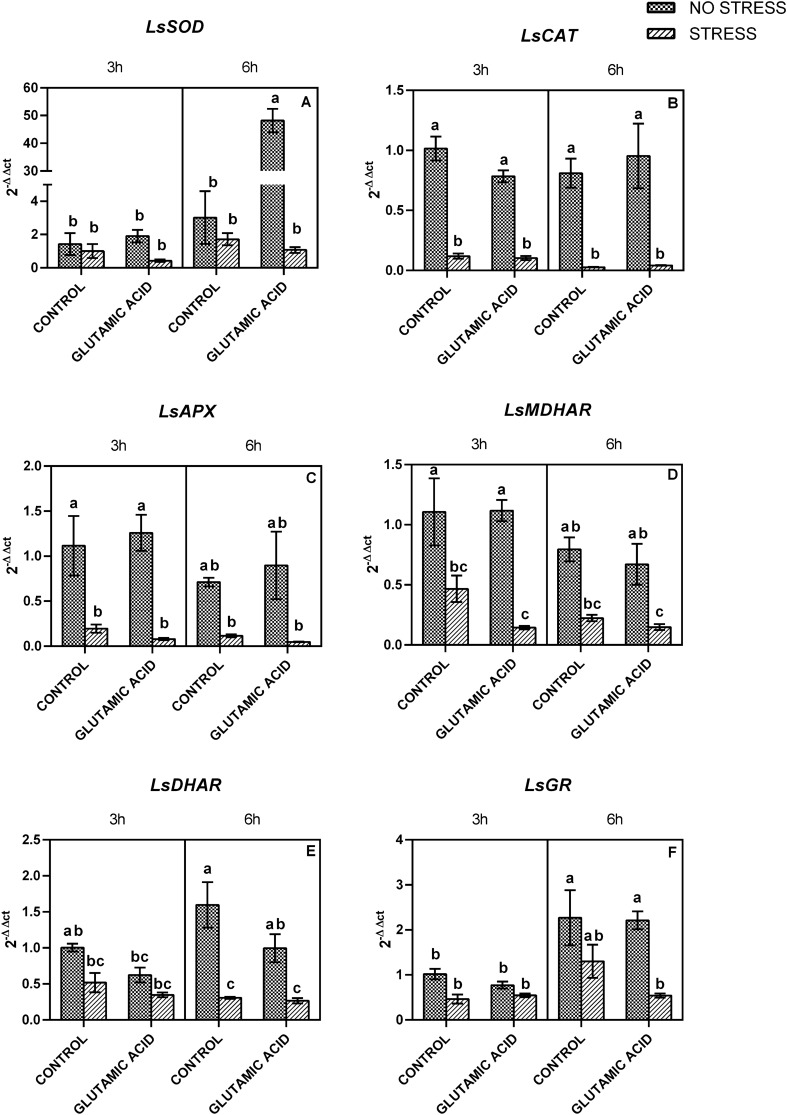
Fig. 3.
Changes in the expression of LsSOD A, LsCAT B, LsAPX C, LsMDHAR D, LsDHAR E, LsGR F in lettuce leaves treated with water (CONTROL) and glutamic acid and grown under two water regimes (well-watered: NO STRESS and water stress and re-watering: STRESS. Measures were taken 3 and 6 h after the third treatment, before the re-watering. Values are means ± SE (n = 6). Data were subjected to three-way ANOVA. Different letters, where present, represent significant differences (P < 0.05)

