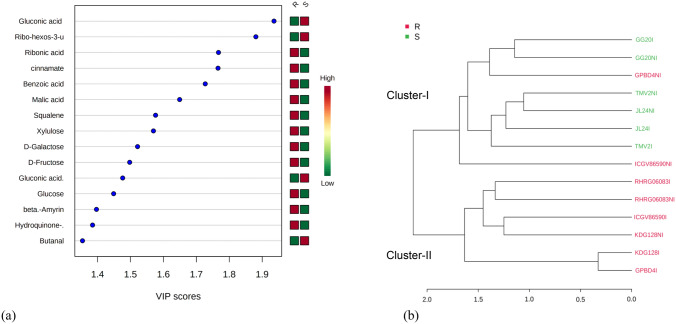
Fig. 3.
a Abundance of metabolites in resistant and susceptible genotypes based on Variable Importance in Projection (VIP) using Partial Least Squares—Discriminant Analysis (PLS-DA).Colour bar indicates high intensity of metabolite levels by brick red colour and low level by green colour. b Dendrogram (Pearson average method) showing clustering of genotypes based on metabolic pattern. Resistant genotypes are denoted by red colour while susceptible genotypes by green colour. Where R: resistant and S: Susceptible, NI: Non-infected and I: Infected (color figure online)

