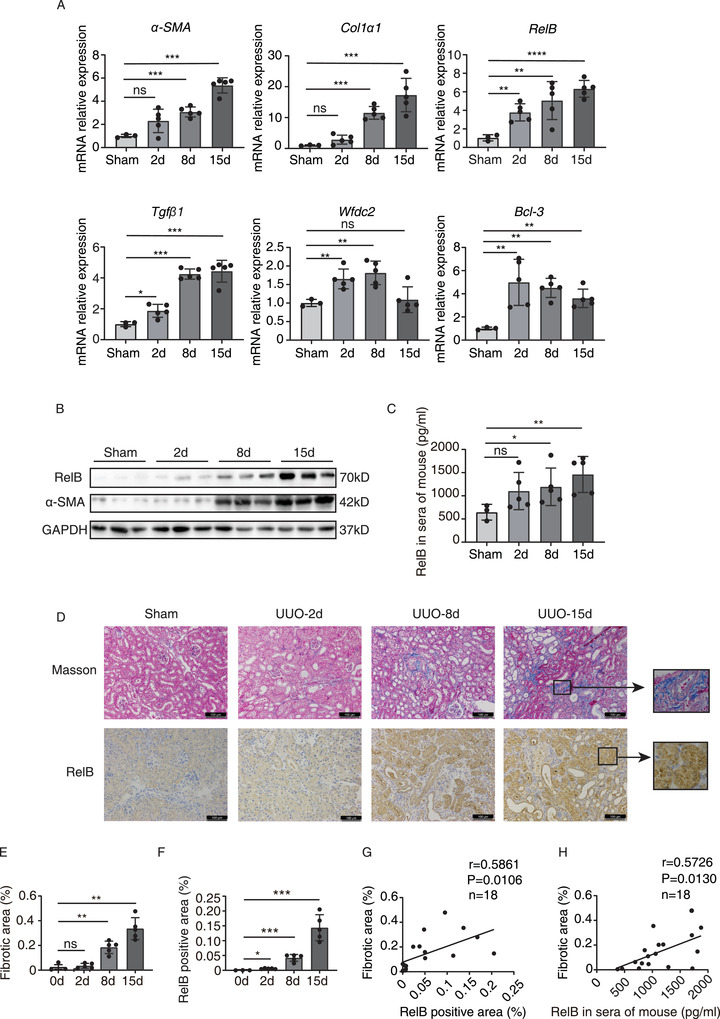
FIGURE 1.

RelB is induced after UUO and correlated with kidney fibrosis in mice. (A) qRT‐PCR analysis of RelB, Wfdc2, α‐SMA, Col1α1, Bcl‐3, and Tgfβ1 in obstructive nephropathy at indicated time points after UUO. Sham group includes three mice while each UUO group includes five mice. (B) Western blot analysis of renal RelB and α‐SMA in obstructive nephropathy at time points of 0 (sham group), 2, 8 and 15 days after UUO. (C) ELISA detection of serum RelB in obstructive nephropathy after UUO at indicated time points. (D) Representative images show renal collagen deposition by Masson's trichrome staining (blue) and RelB expression by immunohistochemical staining at different time points of UUO. Scale bars: 100 μm. (E) Quantitative analysis of the positive areas of Masson's trichrome staining in indicated groups. (F) Quantitative analysis of the positive staining for RelB in indicated groups. (G) Scatter plot with linear regression shows a correlation between tissue RelB expression and kidney fibrosis. r = 0.5861; p = 0.0106; n = 18. (H) Correlation between RelB serum content and kidney fibrosis was implicated by the scatter plot with linear regression. r = 0.5726; p = 0.0130; n = 18. Data were exhibited as mean ± SD. *p < 0.05, **p < 0.01, ***p < 0.001, ****p < 0.0001
