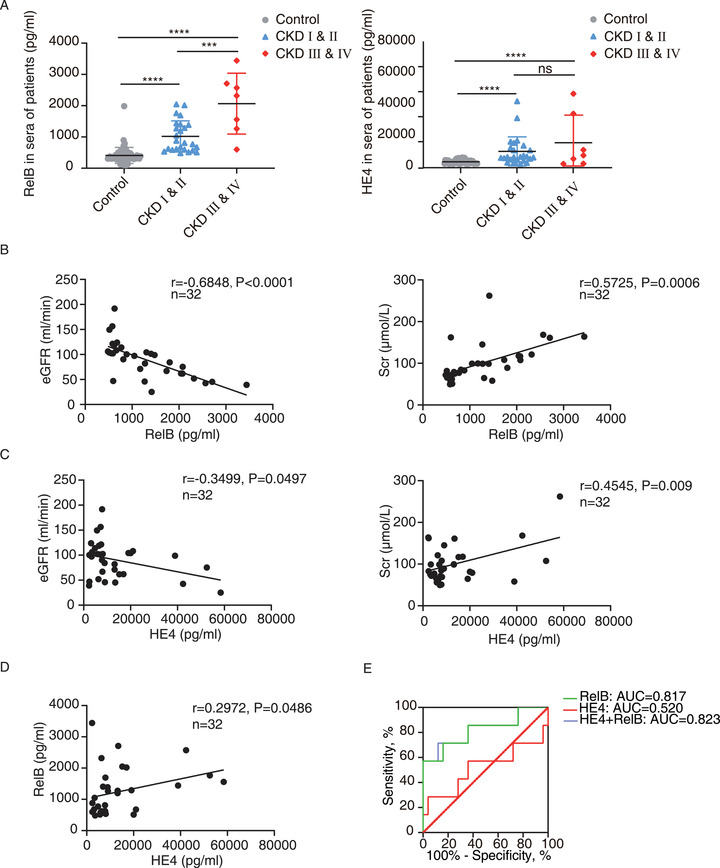
FIGURE 3.

The serum RelB can discriminate CKD patients at different stages. (A) The serum RelB and HE4 levels in the CKD patients with different stages (CKD I and II, n = 25; CKD III and IV, n = 7) and the normal controls (control, n = 60). (B–D) Scatter plot with linear regression implied the content of serum RelB (B), HE4 (C), as well as the combination of RelB and HE4 serum levels (D) had correlations with eGFR and SCr in CKD patients. The Spearman correlation coefficient (r) and p value are shown. (E) The ROC analysis of potential biomarkers including RelB, HE4, and their combination evaluates their ability to distinguish CKD I and II patients from CKD III and IV ones. The associated AUC values are indicated. Data were exhibited as mean ± SD. ***p < 0.001, ****p < 0.0001
