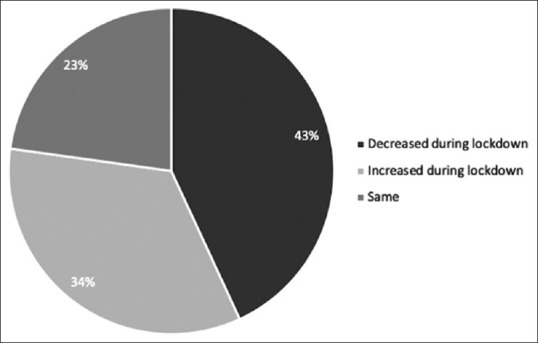
Figure 2.

Pie-chart summarising reported change in work related stress due to the COVID-19 lockdown. Values are expressed as the percentage of subpopulation. The change was statistically verified using the Wilcoxon Signed Rank test (p < 0.001) and the Friedman's Two Way Analysis of Variance by Ranks test (Test statistic = -16.40, P < 0.001)
