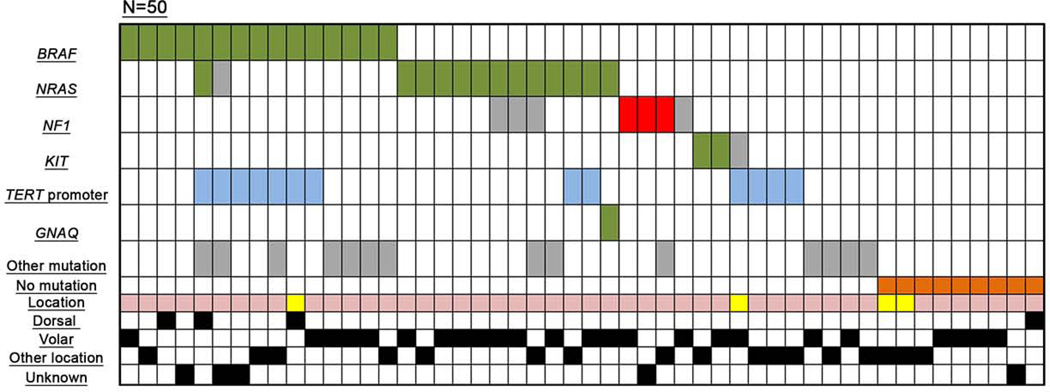
Figure 2. Oncoprint – Mutations identified by targeted next-generation sequencing in the mutational analysis subgroup.
Green: mutations known or assumed to be activating; red: loss of function mutations; blue: mutations in the TERT promoter region; grey: missense mutation (frequently with unknown functional consequences); orange: wild-type samples (showing no mutation in the analyzed gene panel). Tumor location: yellow – upper extremity, light pink – lower extremity.

