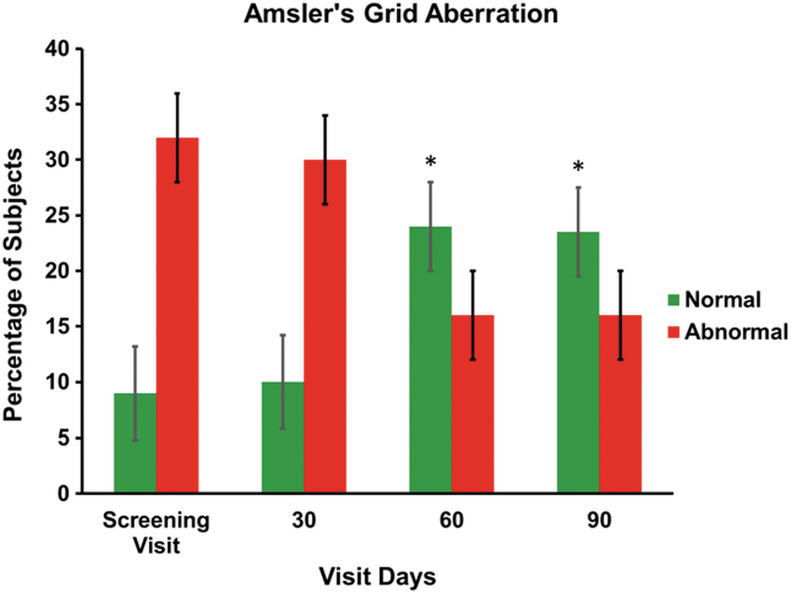
FIG. 4.
The bar graph shows the percentage change of Amsler's grid aberration in subjects on screening visits (baseline) and after treatment on days 30, 60, and 90. Values are presented as mean ± SD. Pairwise “t” test was used for statistical comparison. The change after treatment on 60 and 90 days was found to be statistically significant, *P < .05.

