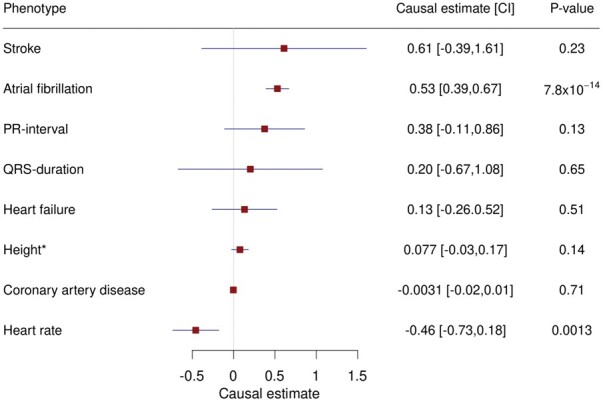
Figure 3.

Forest plot showing causal effect estimates from a Mendelian randomization analysis of putative risk factors on SSS. We regressed published effects of SNPs on the respective exposure phenotype against their SSS effects in deCODE, CHB-CVS/DBDS, and the UK Biobank. The causal estimates are the slopes from the regression lines where a one unit change in the exposure phenotypes equals a one standard deviation change for quantitative traits and an odds ratio of 2.7 for binary exposure phenotypes. The forest plot shows the causal estimates, 95% confidence intervals, and corresponding P-values from the Mendelian randomization analysis. *For height, the result from a multivariate analysis accounting for AF effects is shown.
