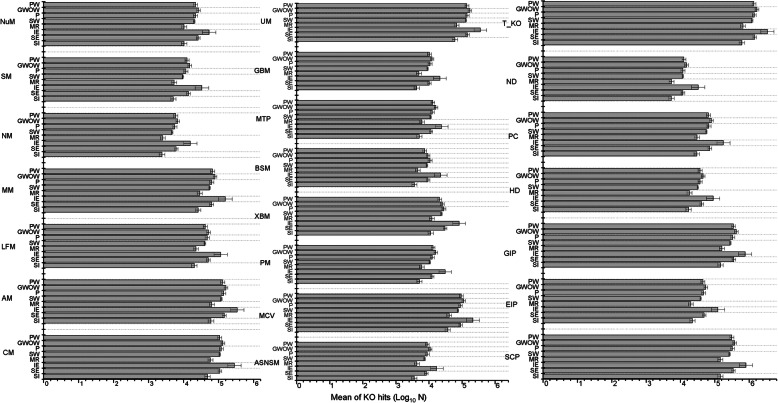
Fig. 5.
Mean KO hits of each function category in different sample categories. NuM = Nucleotide metabolism, SM = Sulfur metabolism, NM = Nitrogen metabolism, MM = Methane metabolism, LFM = Lipid and Fatty acid metabolism, AM = Amino acid metabolism, CM = Carbohydrate Metabolism, UM = Unclassified metabolism, GBM = Glycan Biosynthesis and Metabolism, MTP = Metabolism of Terpenoides and Polyketides, BSM = Biosynthesis of Secondary Metabolites, XBM = Xenobiotics Metabolism, PM = Pyrimidine Metabolism, MCV = Metabolism of cofactors and Vitamins, ASNSM = Amino Sugar and Nucleotide Sugar Metabolism, T_KO = Total KO hits, ND = new to dataset, PC = poorly characterized, HD = Human disease related, GIP = Genetic Information processing, EIP = Environmental Information processing, SCP = Signaling and cellular process. In the sample category, SI = Sewage Influent, SE = Sewage Effluent, IE = Industrial Effluent, ME = Mine Effluent, SW = Surface Water, P = Pretreated, PDT = Production Tube, PDW = Production Well. Error bar is calculated as σ/√n

