Fig. 2.
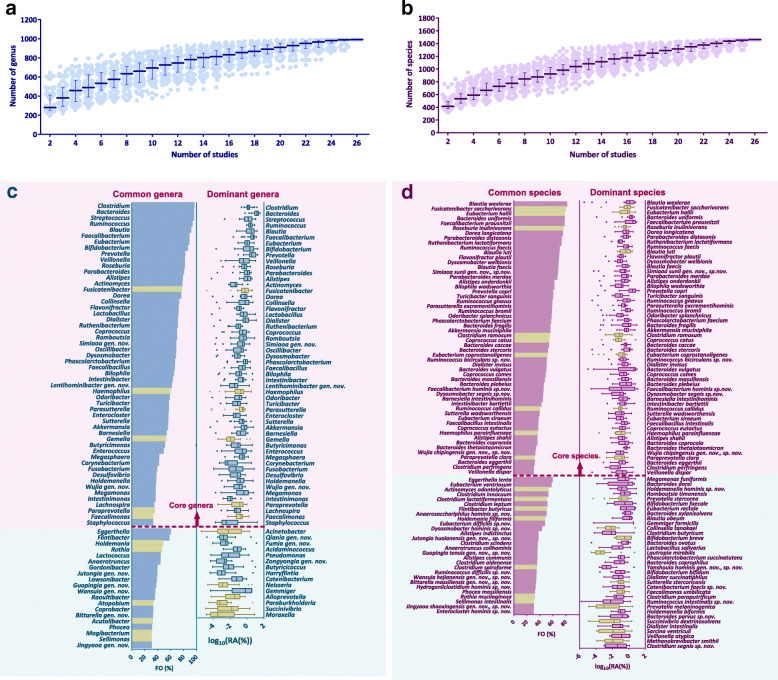
The cultured recovery of major composition of human gut microbiota by hGMB at genus and species levels. a and b The rarefaction curves displaying the increase trend of the numbers of assigned genera (a) and species (b) as 1 to 26 16S rRNA gene amplicon datasets (Table S8) were sampled for combined analysis. c The coverage of human gut common (bar chart) and dominant (box-and-whiskers plot) genera by hGMB. All the genera covered by hGMB were colored in blue while the genera absent in hGMB were color in olive brown. d The coverage of human gut common (bar chart), dominant (box and whiskers plot) species by hGMB. All the genera covered by hGMB were colored in purple while the genera absent in hGMB were color in olive brown. Common genera/species: genera/species with equally weighted average frequency of occurrence (FO) > 30% (definition: FO = 100% is defined when a taxon presents in all samples, while FO = 0 is defined when a taxon presents in none of the samples; The equally weighted average FO is the mean value of the average FOs of the 26 analyzed studies); Dominant genera/species: genera/species with equally weighted average relative abundance (RA) > 0.1% (log 10 (RA(%)) > − 1) (definition: The equally weighted average RA is the mean value of the average RAs of the 26 analyzed studies). The light-pink background in panel c and d highlighted the core genera/species shared by both dominant and common genera/species, while the light-blue background marked out the taxa presenting uniquely in either dominant or common genera/species. The bar chart in panel c and d shows the mean values of the 26 FO averages (%), while the box-and-whiskers plot shows the Log 10 of average Ras (%) of each taxon in each study, center line: median, bounds of box: quartile, whiskers: Tukey extreme

