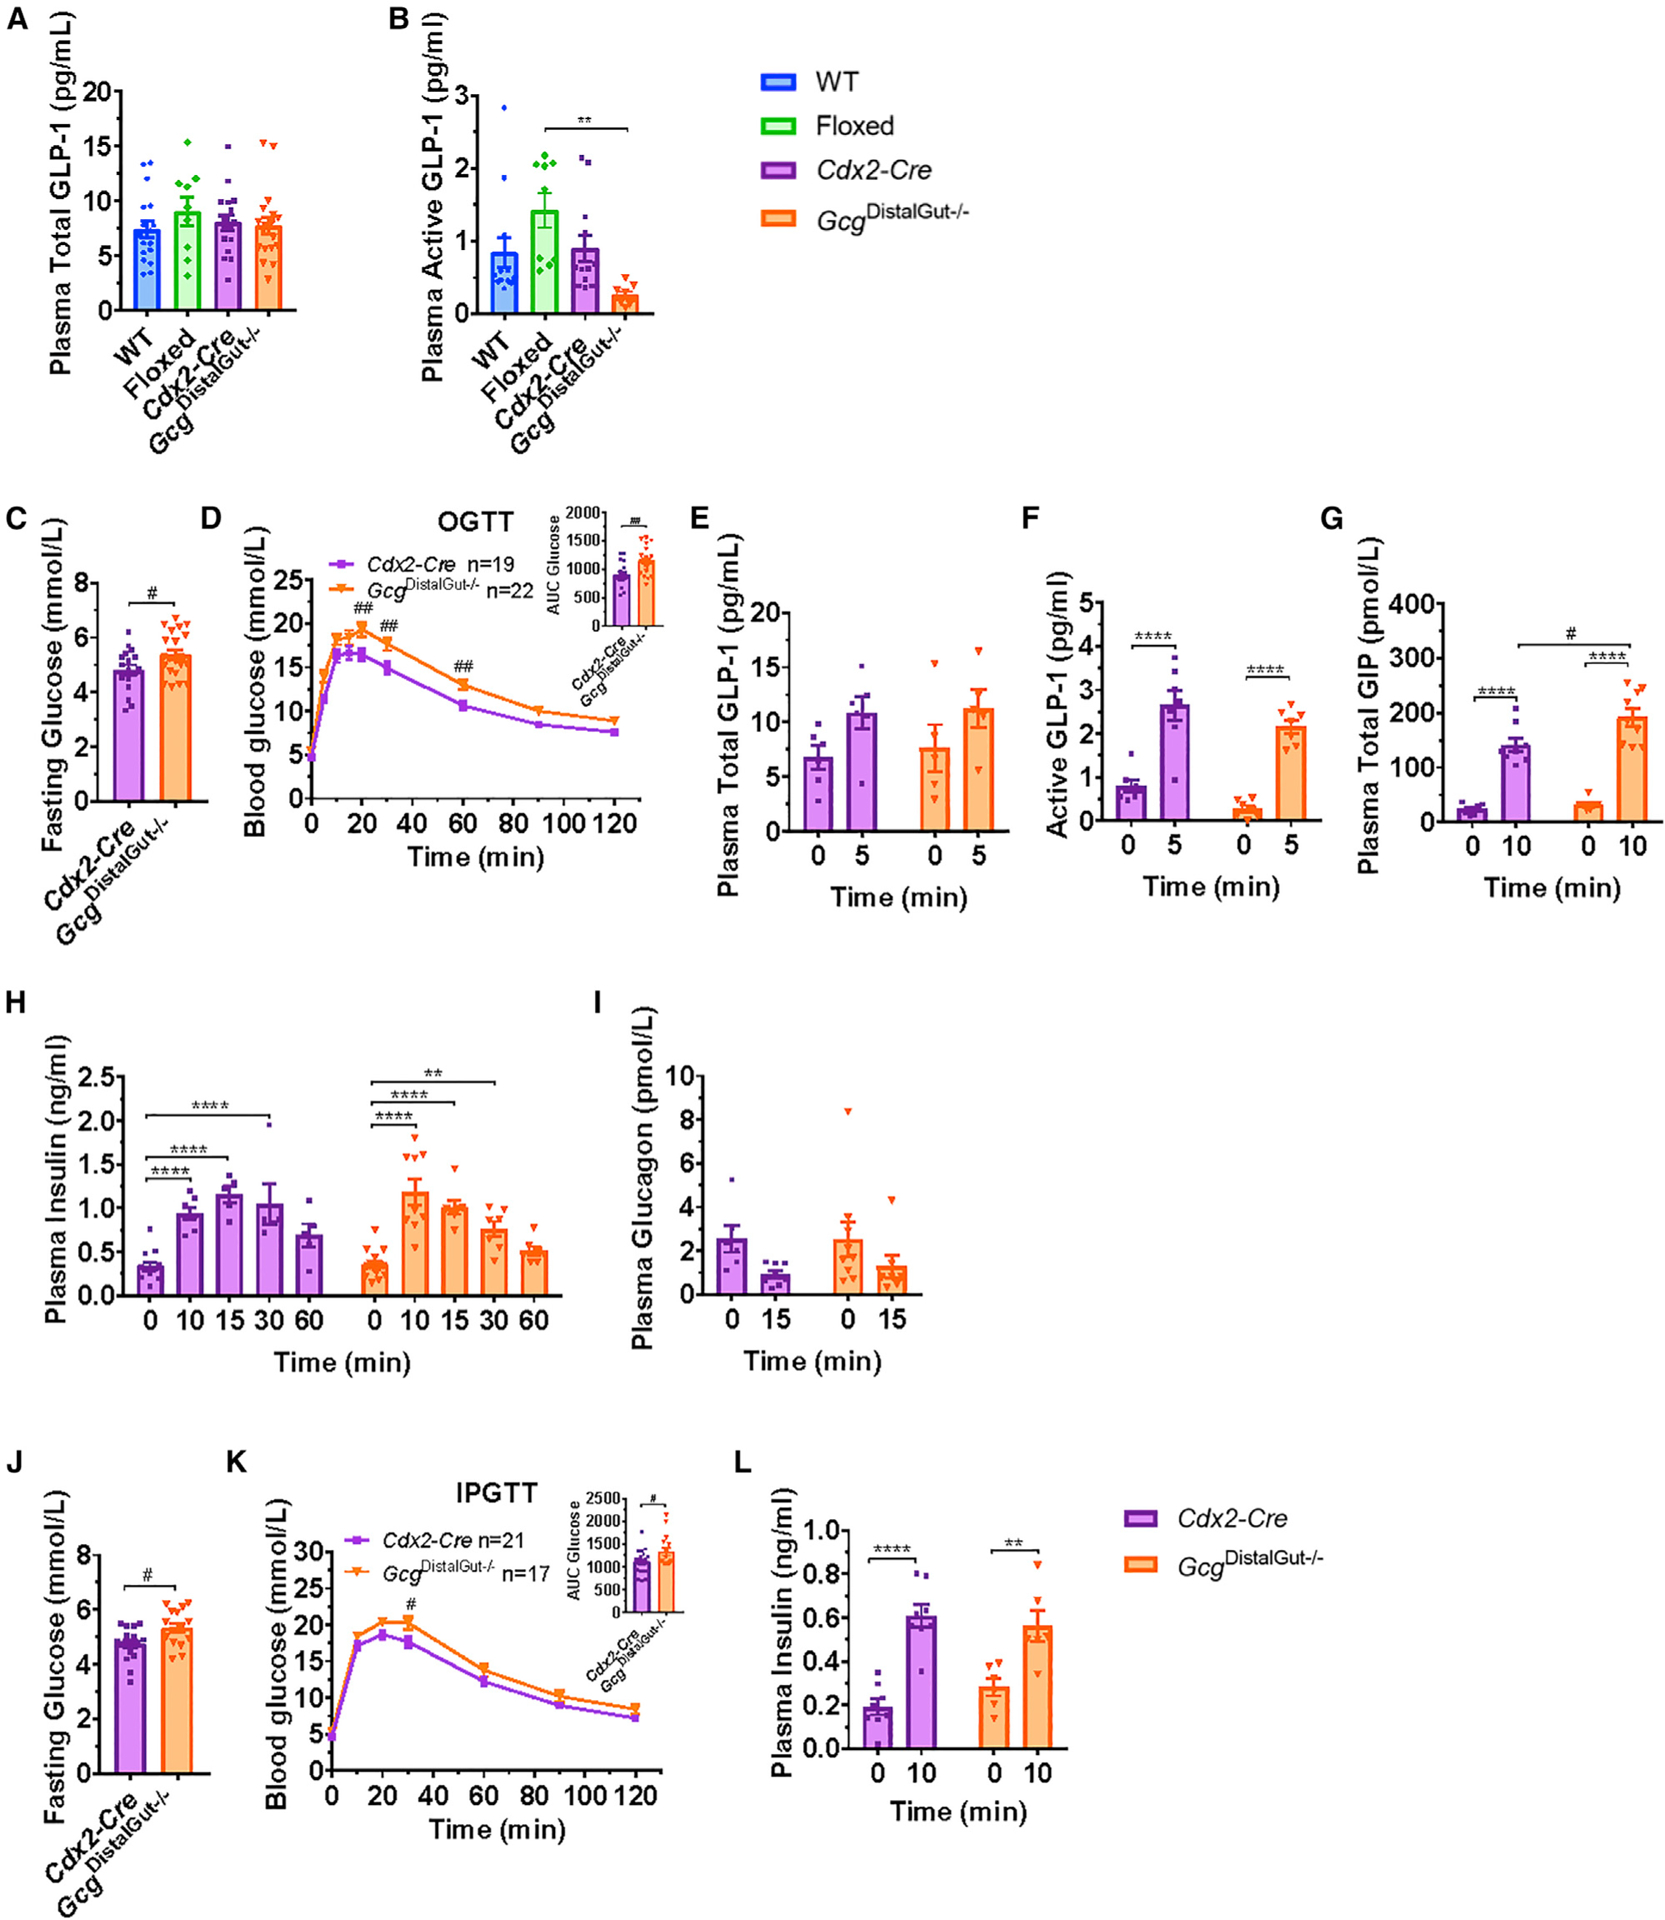
Figure 4. GcgDistalGut–/– Mice Exhibit Impaired Glucose Tolerance.

(A and B) Fasting plasma levels of (A) total GLP-1 or (B) active GLP-1 in overnight fasted 10- to 14-week-old male GcgDistalGut−/− and control mice (n = 7–17/group).
(C and D) Fasting glucose (C) blood glucose levels (D) after oral glucose (OGTT, 1.5 g/kg) and area under the curve (AUC, inset) for glucose excursions in overnight fasted 12- to 15-week-old male GcgDistalGut−/− and Cdx2-Cre control mice (n = 19–22/group).
(E–I) Plasma total GLP-1 (E), active GLP-1 (F), total GIP (G), insulin (H), and glucagon (I) measured before and 5–60 min after oral glucose challenge as indicated (n = 5–9/group).
(J and K) Fasting glucose levels (J) and blood glucose levels (K) following i.p. administration of glucose (IPGTT, 1.5 g/kg) and AUC (inset) for i.p. glucose excursions in overnight fasted 14- to 17-week-old male GcgDistalGut−/− and Cdx2-Cre control mice.
(L) Plasma insulin before and 10 min after an i.p. glucose challenge.
For (J) and (K), n = 17–21/group and for (L), n = 6–8/group. Data are presented as the mean ± SEM. (B) **p < 0.01, control versus GcgDistalGut−/− mice. (C–L)
**p < 0.01, ****p < 0.0001, 0 versus 5–60 min. #p < 0.05, ##p < 0.01, GcgDistalGut−/− versus Cdx2-Cre mice. See also Figures S3 and S4.
