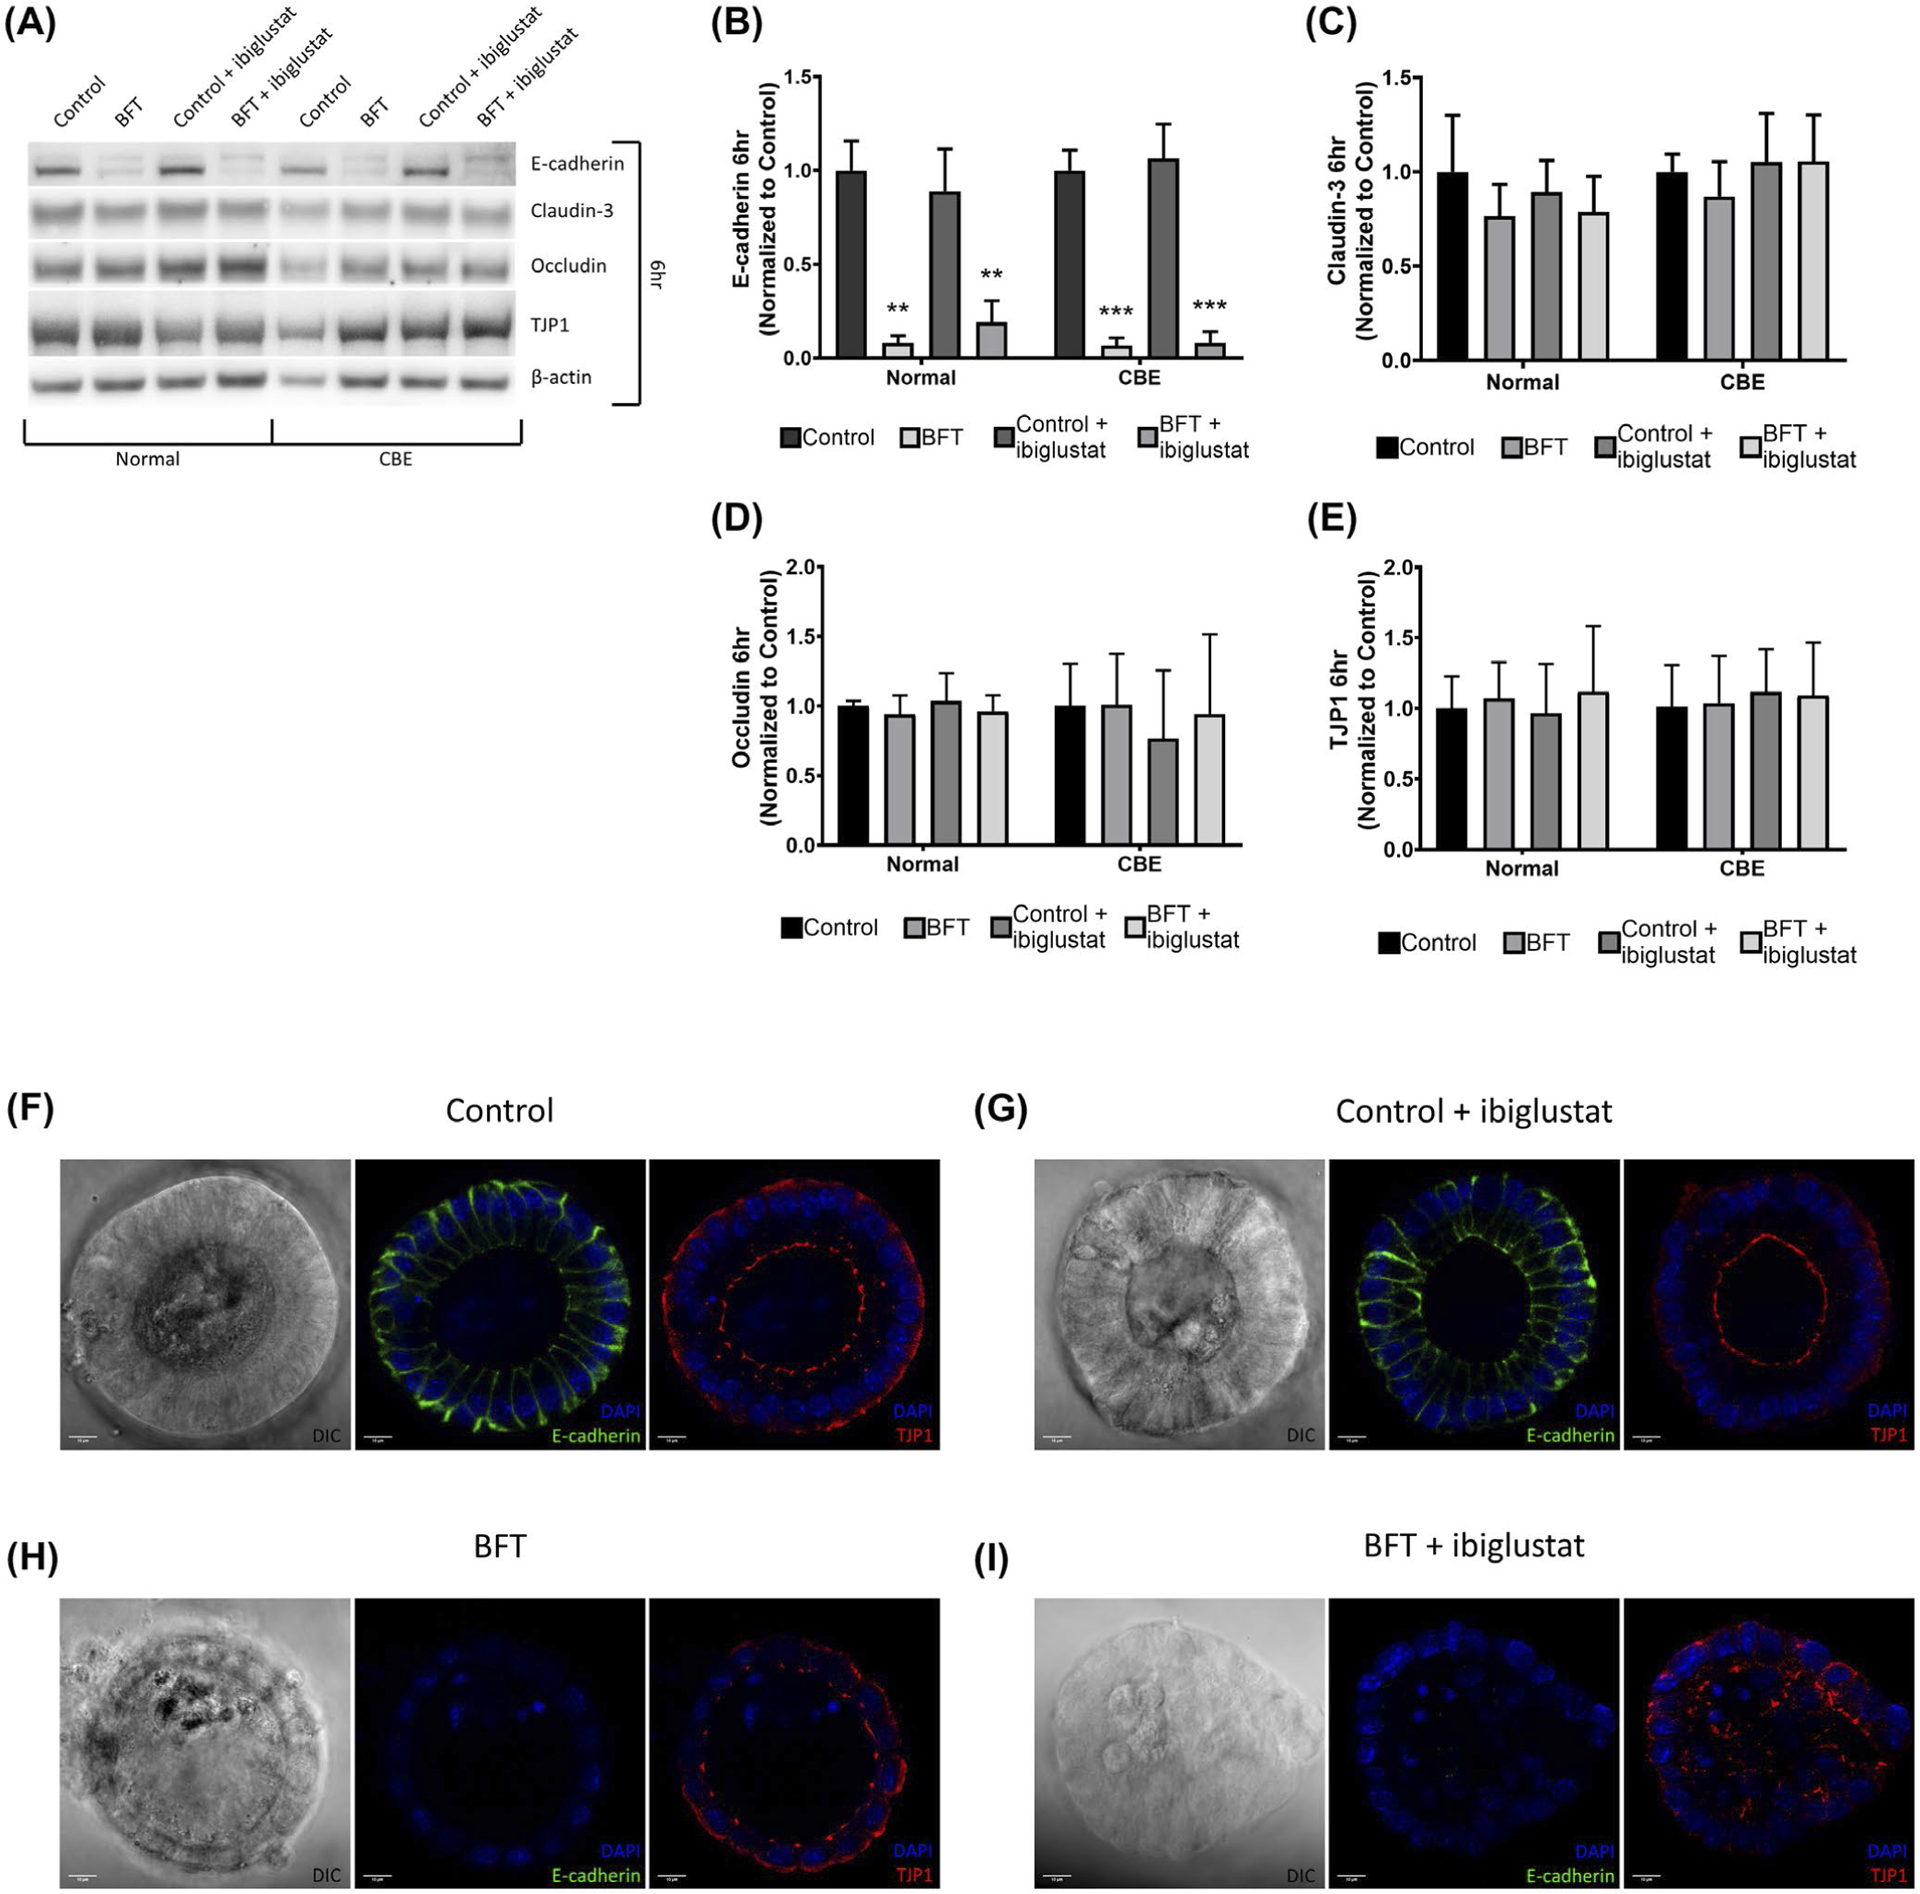
FIGURE 6.

BFT decreases E-cadherin levels in colonoids at 6 h and disrupts TJP1 localization. Colonoids treated with BFT show reduced levels of full-length E-cadherin at 6 h via western blot, but claudin-3, occludin, and TJP1 levels are not significantly impacted by any treatment in normal or CBE colonoids (A). Quantification of E-cadherin western blots shows that BFT significantly decreased levels of full-length E-cadherin in normal and CBE-treated colonoids when compared with their respective controls (B). Claudin-3 (C), occludin (D), and TJP1 (E) levels were all quantified and did not change significantly when compared to the control treatments. Confocal immunofluorescence of colonoids for E-cadherin, TJP1, and DAPI (nuclear stain) confirms western results. Control-treated colonoids displayed normal E-cadherin and TJP1 expression (F). The addition of ibiglustat did not impact E-cadherin or TJP1 expression when compared to the control (G). In colonoids treated with BFT, the E-cadherin signal was almost entirely eliminated. TJP1 localization at the apical membrane was less consistent than in the control treatments (H). BFT + ibiglustat treatment resulted in almost no E-cadherin expression, while TJP1 localization was disorganized and irregular (I). Western blot results were compiled among multiple experiments (n = 6 biological replicates for all targets except occludin, n = 3). Values for each target were normalized to their respective β-actin value to control for loading variability. Finally, adjusted values were then normalized to the average of their respective control, where the control value was arbitrarily set to one (normal colonoids were normalized to the average of all control values, while CBE colonoids were normalized to the average of all CBE control values). Representative blots are shown for each target. Group comparisons were performed using a one-way ANOVA and Tukey’s multiple comparisons test. Statistical significance of each individual treatment when compared to the respective control is indicated by asterisks: **P < .01 or ***P < .001. Error bars represent the standard deviation of the mean. Confocal images were captured using a 63x oil-immersion lens. Scale bar indicates a distance of 10 μm. Normal represents colonoids grown under normal conditions, while CBE represents colonoids grown in CBE. Control represents concentrated bacterial culture supernatant from ETBFΔbft and BFT represents concentrated bacterial culture supernatant from ETBF
