FIGURE 7.

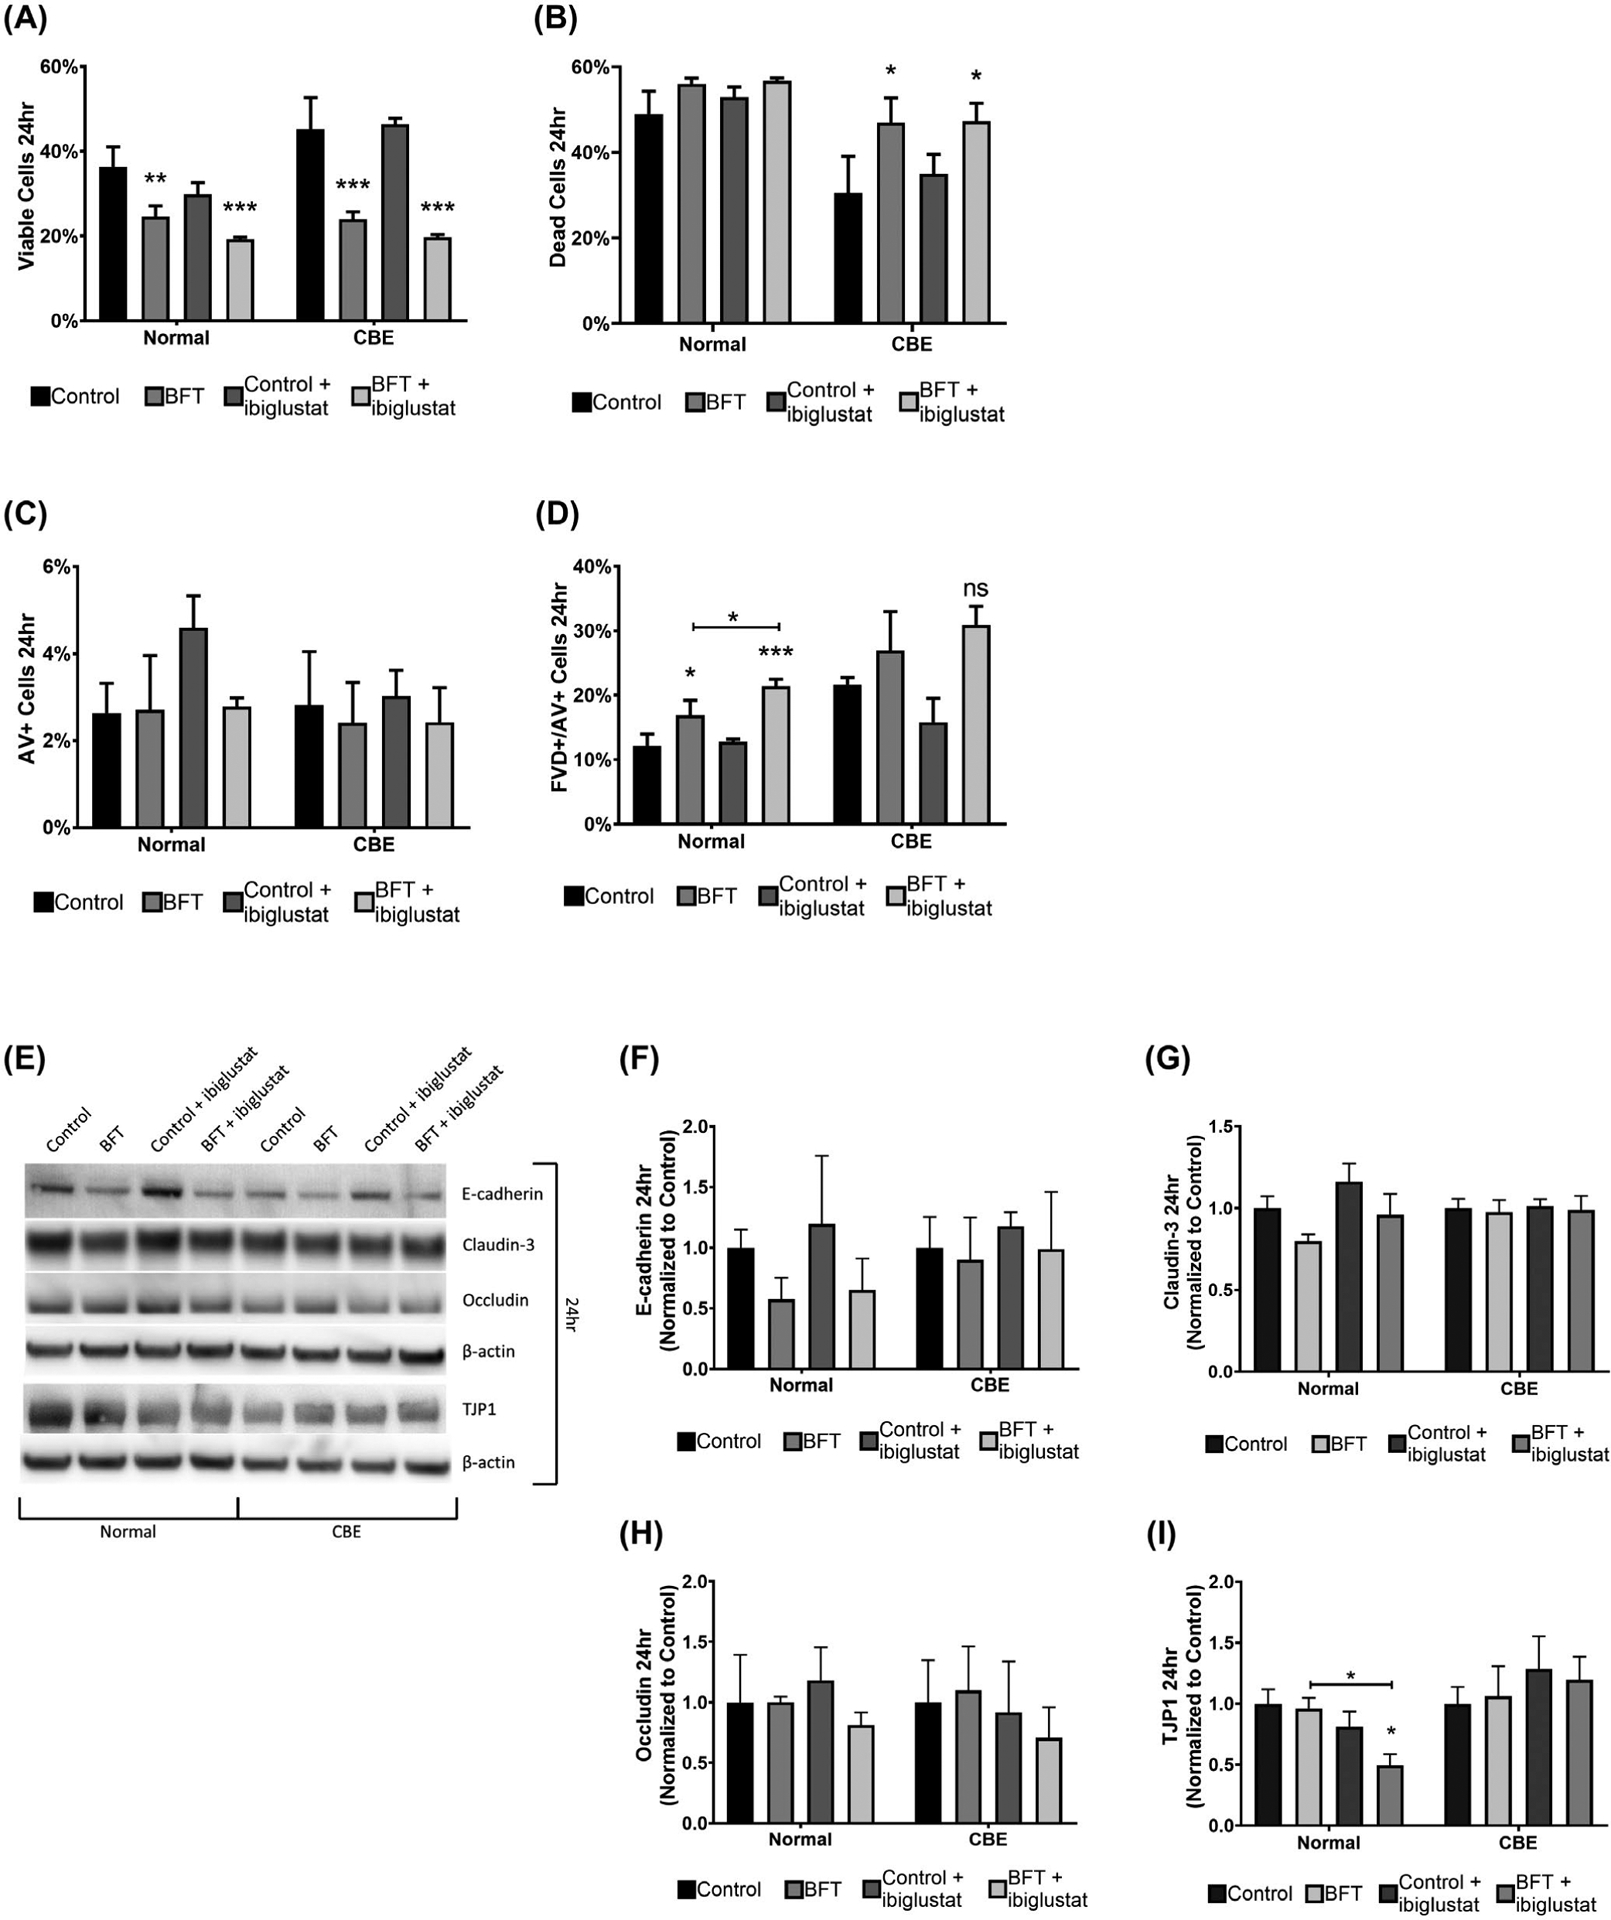
BFT-treated colonoids are less viable and have decreased TJP1 expression when GCS is inhibited. Cell viability and apoptosis were determined by flow cytometry using a fixable viability dye (FVD) and Annexin V (AV) staining, respectively. At 24 h, BFT and BFT + ibiglustat significantly decreased the number of viable cells in both normal, and CBE colonoids (A). BFT and BFT + ibiglustat significantly increased the number of dead cells in CBE colonoids (B). Early apoptotic cells, measured by AV + staining, were not significantly impacted by any treatment in normal or CBE colonoids (C). Colonoids treated with BFT and BFT + ibiglustat had significantly higher percentages of cells in the late apoptosis/necrosis stage in normal colonoids, but non-significantly increased levels in CBE colonoids, as indicated by FVD+/AV + staining (D). Colonoids were collected 24 h after initial BFT treatment for protein and E-cadherin, claudin-3, occludin, and TJP1 were measured (E) and quantified. E-cadherin levels were non-significantly reduced in normal colonoids treated with BFT, but close to baseline in CBE colonoids (F). Claudin-3 (G) and occludin (H) levels were not significantly altered by any treatment. TJP1 expression was significantly decreased in normal colonoids treated with BFT + ibiglustat when compared to control or BFT alone, but not in CBE colonoids (I). Western blot results were compiled among multiple experiments (n = 6 biological replicates for all targets except occludin, n = 3). Values for each target were normalized to their respective β-actin value to control for loading variability. Finally, adjusted values were then normalized to the average of their respective control, where the control value was arbitrarily set to one (normal colonoids were normalized to the average of all control values, while CBE colonoids were normalized to the average of all CBE control values). Representative blots are shown for each target. Group comparisons were performed using a one-way ANOVA and Tukey’s multiple comparisons test. Statistical significance of each individual treatment when compared to the respective control is indicated by asterisks: *P < .05, **P < .01, or ***P < .001. Statistical significance between treatment groups is shown by an asterisk above a line. Error bars represent the standard deviation of the mean. Normal represents colonoids grown under normal conditions, while CBE represents colonoids grown in CBE. Control represents concentrated bacterial culture supernatant from ETBFΔbft and BFT represents concentrated bacterial culture supernatant from ETBF
